
Introduction
Echocardiography utilizes ultrasound to image the cardiovascular system from both an anatomical and a physiologic standpoint. The advances in echocardiography initially began with Inge Edler, often considered the father of echocardiography, who utilized an early motion-based technique called M-mode.[1] In the 1970s, S.L. Johnson, Holen, and Hatle developed technological capabilities allowing the measurement of blood flow as well as the detection of pressure gradients between cardiovascular structures. Using concepts formulated by D. Bernoulli in 1738 and L. Euler in 1752, they developed one of the most utilized techniques used in modern-day echocardiography, the Bernoulli equation (see Image. Bernoulli Equation).[1]
With its ability to assess real-time hemodynamics, echocardiography has played an important role in the modern-day management of patients.[2][3] It involves several basic physical and mathematical principles (i.e., volume, velocity, area, pressure, etc.). In this article, we will discuss the basics of echocardiography hemodynamics, specifically four major principles: the conservation of energy (Bernoulli’s principle), the hydraulic formula of flow, conservation of mass (the continuity equation), and proximal iso velocity surface area (PISA).[4]
Function
Register For Free And Read The Full Article
 Search engine and full access to all medical articles
- 10 free questions in your specialty
- Free CME/CE Activities
- Free daily question in your email
- Save favorite articles to your dashboard
- Emails offering discounts
Learn more about a Subscription to StatPearls Point-of-Care
Function
In echocardiography, there are four basic principles utilized for the hemodynamic assessment of the heart. The foundation of hemodynamics in echocardiography revolves around the Doppler principle. Doppler describes two physical entities; flow and direction. The Doppler effect states that as an emitting object changes direction, the frequency of the wave produced will also vary relative to the receiving object. In echocardiography, the ultrasound probe is the emitting source, and red blood cells reflect the emitted waves.[5] Hence, as a red blood cell moves towards the probe, a positive doppler shift is observed and vice versa. Doppler shift is affected by three variables: probe frequency, the velocity of blood, and angle of insonation. The probe's frequency has a direct correlation with the doppler shift generated. High-frequency probes are more sensitive to flow however sacrifice penetration ability through tissue. Low-frequency probes are less sensitive to flow; however, they have improved penetration. Examples of this are seen in the difference between a higher frequency transesophageal echocardiography probe, which has improved near field resolution, versus a lower frequency transthoracic probe. In addition, the velocity of blood also has a direct correlation with the doppler shift generated.[5] Higher velocity blood cells will create a larger Doppler shift when compared to slow-moving red blood cells. Finally, the angle of insonation should be optimized to be parallel to the direction of blood flow to maximize the Doppler shift.[6]
Spectral doppler provides a graphical illustration of velocity on the y-axis and time on the x-axis. Blood flow towards the probe will be a positive deflection, and there will be a negative deflection when blood flow is away from the probe. Spectral doppler can be further divided into pulsed-wave Doppler and continuous wave.[7][8]
Pulsed-wave (PW) Doppler sends pulsatile ultrasound waves to a specific location then pauses to receive the reflected waves. Due to the inherent pause of PW-Doppler, it intrinsically follows a principle called pulse repetition frequency (PRF).[5] PRF is the cycle where the probe emits an ultrasonic wave and thereafter receives the reflected wave.[5] The PRF has two variables: the ultrasound transducer utilized and the target's depth. Another important concept involving PW Doppler is the Nyquist limit. The Nyquist limit is the upper limit of velocity that is detectable by PW doppler. The Nyquist limit can be optimized for faster moving flows by turning the PRF higher.[7]
Nyquist limit= PRF/2
If the Nyquist limit is exceeded, PW Doppler suffers from aliasing. The advantage of PW Doppler is its ability to assess specific locations in regions of interest. The Nyquist limit has a prominent role with the principle of proximal iso velocity surface area (PISA), which will be discussed in detail later.[6]
Continuous-wave (CW) Doppler sends continuous ultrasound waves while simultaneously receiving the reflected signals.[5] Continuous-wave Doppler is an echocardiographic technique that allows for assessing the highest velocities within a region of interest. Information acquired via this technique is recorded as a "Doppler envelope," representing every moving red blood being assessed within a specific field of view. Both flow towards and away from the probe can be assessed. The advantage of continuous-wave Doppler is that flow can be assessed at any point, and maximum velocities can be obtained; however, location cannot be determined. Continuous-wave Doppler is not affected by aliasing artifact.[7]
The principles of Doppler will be demonstrated throughout this article with various uses with each of the three major principles, as mentioned above.
Bernoulli Equation
The first major principle that will be discussed is the Bernoulli equation which is demonstrated in the "Bernoulli equation" image below.
h= height, p= pressure, v= velocity, g=gravity acceleration of earth, and rho= density of a fluid.
Each term will be an energy density that, if added together, are constant throughout a conduit. The first term is pressure energy (p), the second term is kinetic energy (½ Rho * V^2), and the third is potential energy (rho*g*h). In echocardiography, the potential energy component can be eliminated since it is negligible. Based on the law of conservation of energy, within a closed system, the total energy is constant. When blood transverses through a region of flow turbulence, the velocity increases, and pressure inversely decreases. Thus, the pressure gradient between two objects can be obtained using the Bernoulli equation:
Pressure gradient = 4 x ([V2]^2-[V1]^2)
V1 is upstream velocity, and V2 is the downstream velocity in meters/sec
This equation is utilized for the calculation of pressure gradients between cardiac structures. Due to the closed-loop circuit of the heart and commonly only one single area of flow turbulence, the modified Bernoulli principle can be utilized, eliminating V1, giving the following equation:
Pressure (P) = 4 x (peak velocity)^2
However, it is important to understand that if the V1 is more than 1 m/s, the above equation modification would not be applicable. This is seen in situations of tandem stenotic lesions.[6]
This concept is used commonly in echo-hemodynamics, specifically in the assessment of chamber pressure assessment.
For example, the right ventricular systolic pressure (RVSP) can be estimated from the velocity of the tricuspid regurgitation (TR) jet when added to the right atrial pressure (RAP). This can be seen in the equation below:
RSVP = 4 x (peak TR velocity)^2 + RAP
TR peak pressure gradient= RVSP-RAP
In the setting of no significant pulmonic valve stenosis, RVSP = pulmonary artery systolic pressure. In this regard, echocardiography can be used in the initial assessment of pulmonary hypertension.
Continuity Equation
The formula of flow originates from the principle of conservation of mass. The basic parameters used when defining flow in echocardiography are the cross-sectional area of a circle (CSA) and the time-velocity integral (VTI). The units of VTI and CSA are cm/stroke and cm^2, respectively. VTI is a clinical doppler echocardiographic technique acquired by using both continuous and pulse wave Doppler. In VTI assessment, the area under the velocity-time curve is calculated by tracing the spectral Doppler envelope. Regions of interest (i.e., left ventricular outflow tract (LVOT)) can be assessed by this method. Using the VTI and CSA across a region of interest, stroke volume can be calculated. This principle can be shown by using pulse wave Doppler across the left ventricular outflow tract. Hence, CSA_LVOT x VTI_LVOT = stroke volume. The VTI, a mathematical representation of integration, is the area under the curve of the velocity (on the y-axis) and time (on the x-axis).
The continuity equation is as follows, as demonstrated in the AV equation image (see Image. AV Equation).
V1 x Area1= V2 x Area2
V1 is the velocity at point 1, and V2 is the area at point 2.
In the above equation, the area has an inverse relationship with velocity. This equates to as area increases velocity decreases and vice versa. The most common instance where this equation is utilized is in assessing valve area in stenosis. For example, for aortic stenosis assessment where AV stands for aortic valve:
CSA_LVOT x VTI_LVOT = CSA_AV x VTI_AV
CSA_AV = CSA_LVOT x VTI_LVOT/ VTI_AV
The equation for stroke volume= CSA_LVOT x VTI_LVOT
Where CSA_LVOT is the area of the LVOT, VTI_LVOT is the VTI across the AV, CSA_AV is the area of the aortic valve, and VTI_AV is the VTI across the aortic valve.
The continuity equation also allows for assessing other parameters such as cardiac output via the ability to calculate stroke volume. The continuity equation can be utilized in any valve but with the assumption that the same volume will flow through all the heart chambers and across all the valves if they are all competent. Stroke volume can be assessed by multiplying the CSA of a region of interest and the VTI of the same region of interest (this is seen in the numerator of the continuity equation). Similarly, using the parameters of one valve can be utilized to calculate the parameters of another valve (i.e., stroke volume through the mitral valve should equal the stroke volume through the aortic valve in the absence of valvular regurgitation).
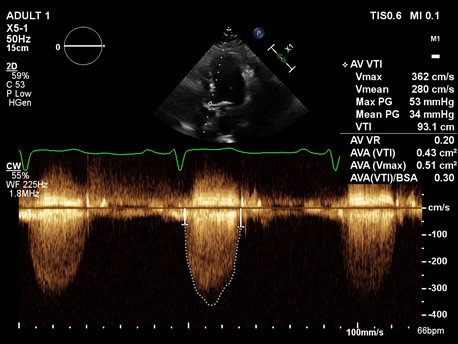
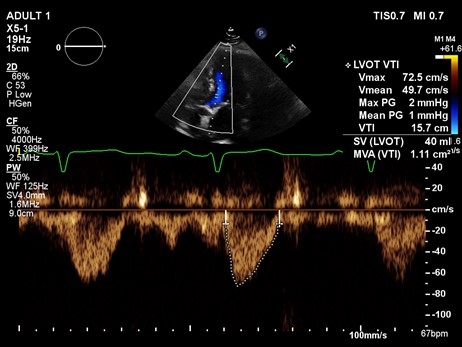
Example 1: A 85-year-old female underwent an echocardiogram which showed a continuous wave through the aortic valve (A) and pulse wave through LVOT (B), with a measured LVOT diameter of 1.8 cm. See images. Echo A and Echo B.
A continuous doppler across AV showed a peak velocity of 3.62 m/sec. From this, we can calculate peak gradient using the modified Bernoulli equation.
Pressure gradient = 4 x (V^2).
Peak gradient = 4 x (3.62)^2
Peak gradient = 52.4 mmHg.
Now we can calculate the aortic valve area using the continuity equation.
AV area x AV VTI = LVOT area x LVOT VTI
AV area = (LVOT area x LVOT VTI)/ AV VTI
AV area = [ π x (0.9)^2) X LVOT VTI] / AV VTI
AV area = [2.54 X 15.7]/93.1
AV area = 0.43 cm^2
Flow assessment via the concepts from the continuity equation is also used for parameters for valvular regurgitation assessment. This concept is applied when calculating regurgitant volume and regurgitant fraction.
Regurgitant Volume (RV)= SV - SV
SV= stroke volume
REGURGITANT FRACTION= RV/SV of regurgitant valve
EROA= RV/VTI of regurgitant valve
Regurgitant volume and fraction can be calculated via extrapolation of the continuity equation. First, the determination of LVOT diameter and VTI shall be used with the mitral valve's diameter and VTI via PW doppler. The mitral VTI, when calculated, must include both the E and A waveforms of the flow profile. Hence, with the SV = CSA x VTI equation, we can calculate the respective SV of the regurgitant valve and the competent one and thus determine the RV as in the equations above.
The degree of regurgitation through either semilunar valve can be estimated by utilizing some of the mathematical principles demonstrated above as illustrated in the calculation of regurgitant volumes (RV) in the formula below:
RV_AV = SV_AV- SV_PVRV_PV = SV_PV- SV_AV
AV= aortic valve PV=pulmonic valve
PISA
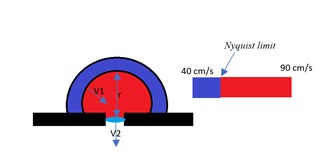
As blood flows through an orifice, all equidistant points towards the orifice show the same velocity.[7] This phenomenon is called the PISA. In other words, it is another form of the continuity equation that can be represented by Proximal Isovelocity Surface Area (PISA) flow that can create a hemisphere with equal velocity along that surface, as demonstrated in the figure below, labeled as "PISA and Nyquist Limit."[9] See Image. PISA and Nyquist Limit.
The Nyquist limit, a signal processing echo-doppler technique, can help in colored doppler to estimate the velocity along with the PISA. It gets an accurate PISA diameter, the Nyquist limit is moved towards the direction of the jet to get a good shell around the regurgitant jet, and the radius could be measured. If there is a regurgitant valve, then one measures the effective regurgitant orifice area (EROA). If it was stenosis, then the measure should be the effective regurgitant orifice area (EROA); thus, multiplying these parameters by VTI, one will get the RV of the valve in question.
PISA creates the illusion of multiple concentric spheres of flow convergence.[7] Each sphere has the same velocity, with the fastest velocity being the smallest sphere.[7] PISA can be used for all the valves; however, it is commonly used in mitral valve regurgitation. PISA hemispheres are produced on the ventricular side of the mitral valve during systole, and on the atrial side of the mitral valve during diastole is cases of mitral stenosis.[7]
PISA flow rate = Regurgitant flow rate
CSA_PISA x Velocity_PISA = EROA_MV x Velocity_MV
MV= Mitral Valve
The following formulae can be derived from this concept that helps calculate effective regurgitant area and regurgitant volume.
PISA = 2 x π x radius^2
Effective regurgitant orifice area (EROA) = (PISA x Aliasing velocity) / max velocity
Regurgitant Volume = EROA x MV VTI
Example 2: A 58-year-old male with shortness of breath undergoes an echocardiogram. An "apical four-chamber view shows regurgitant jet with PISA" figure and "MV VTI" figure below.
PISA = 2 x π x radius^2
PISA = 2 x 3.14 x (0.7 cm)^2
PISA = 3.07 cm^2
Effective regurgitant orifice (EROA) = (PISA x Aliasing velocity) / max velocity
EROA = (3.07 x 38.5 cm/s) / 449 cm/s
EROA = 0.26 cm^2
Regurgitant Volume = EROA x MV VTI
Regurgitant Volume = 0.26 cm^2 x 177 cm
Regurgitant Volume = 46 cc
Issues of Concern
Noninvasive echocardiographic techniques have a minimally invasive approach, and the only contraindication is the refusal of the patient to undergo the testing. Moreover, the patient’s habitus will possess limitations on the penetration of the ultrasound waves to determine echocardiographic landmarks—limitations in acquiring doppler signals which could underestimate the gradient, velocity, and associated calculations for hemodynamics.
Clinical Significance
The stroke volume (SV) has several clinical significances in hemodynamics, most notably in Point-Of-Care US (POCUS) to assess fluid responsiveness in critically ill patients who are inactive shock and to determine the etiology of the shock, intraoperative cardiac output monitoring, or as cardiac output (CO) calculation method per CO= Heart Rate (HR) x SV.[10][2]
The RUSH (rapid ultrasound in shock) exam is an imaging technique that evaluates three components involved in producing mean arterial pressure (MAP).[11] This review will focus on the pump component of this examination, examining pericardial effusions, right ventricular dilation, and Left Ventricle contractility. Pericardial effusions can be detected and differentiated from pleural effusions, where they will be located anterior to the descending aorta and posterior pericardial reflection. Upon identifying pleural effusions, then echocardiographic signs of tamponade can be evaluated with the collapse of the RV. Furthermore, right ventricular dilation can be estimated with its clinical significance in pulmonary embolism causing right ventricular strain.[12] The left ventricle to right ventricle ratio is 1:0.6. However, right ventricular hypertrophy can exceed right ventricular dilation due to chronic pathologic processes such as pulmonary hypertension. Lastly, left ventricular (LV) contractility can be evaluated visually and via the utilization of the M-mode.[13]
Visually, the diastolic and systolic difference in the chamber size will be noticeable, hence, allowing to categorize the patient’s LV contractility as normal, decrease (mild-moderate or severe), and hyperdynamic.[13] The hyperdynamic state is best seen in distributive and hypovolemic states where the LV will be reduced and hyperkinetic obliterating LV systole. The M-mode technique will place the cursors across the LV beyond the MV leaflets to estimate the LV diameter. The fractional shortening (FS) can be calculated via utilizing the formula below [14]:
- FS= [(EDD-ESD)/EDD] x 100
- EDD= end diastolic diameter; ESD= end systolic diameter
A normal FS has values of 30% to 45%, which is semi-quantitative for normal ejection fraction (EF) and the overall LV contractility.[14] Furthermore, the M-mode tracer can be placed to evaluate the anterior leaflet of the MV to evaluate the EPSS (E-point septal separation).[14] The EPSS is a measure of the MV excursion where a decrease in cardiac contractility is indicated by an increase in the distance between the anterior MV leaflet and the ventricular septum. There will be two waves on the M-wave doppler tracing, the E and the A wave, indicating the maximum MV opening initially and the left atrial contraction later to fill the LV, respectively. An EPSS<7 mm indicated normal values, and values larger than 1 cm are reliable at dictating the decrease of the EF.[15] One assumption to the accuracy of this method is the lack of MV pathologies, Aortic Regurgitation, or extreme Left Ventricular Hypertrophy.
Moreover, there are four types of shock hypovolemic, cardiogenic, obstructive, and distributive, where echocardiographic findings are unique to each. In hypovolemic shock, the heart is hypercontractile and reduced in size. In cardiogenic shock, the heart is hypo-contractile and dilated in size.[16] In obstructive shock, pericardial effusion can be observed, right ventricular strain, and or hypercontractile heart.[16] In distributive shock, the heart is hypercontractile in early sepsis and hypo-contractile in late sepsis. In the characterization of the various shocks discussed comprehensive RUSH exam needs to be taken into consideration to better characterize a shock and provide optimal care for the patient; hence, we limit the discussion to echocardiographic findings.[16]
Enhancing Healthcare Team Outcomes
Echocardiographic techniques are vital in evaluating hemodynamics, and the incorporation of invasive techniques can further our capacity to manage patients, especially in the critical care setting.[11][17] The utility of echocardiographic techniques with hemodynamic parameters can direct initial interventions and provide accurate assessments of patients and the potential solutions to issues involving patients’ hemodynamics and correlation with structural anatomy factors.[18]
Media
(Click Image to Enlarge)

Bernoulli Equation
Contributed by A Hussain-Amin, MD
(Click Image to Enlarge)

AV Equation
Contributed by A Hussain-Amin, MD
(Click Image to Enlarge)
Echo (A)
Contributed by A Parekh, MD
(Click Image to Enlarge)
Echo B
Contributed by A Parekh, MD
(Click Image to Enlarge)
PISA and Nyquist Limit
Contributed by A Hussain-Amin, MD
References
Singh S, Goyal A. The origin of echocardiography: a tribute to Inge Edler. Texas Heart Institute journal. 2007:34(4):431-8 [PubMed PMID: 18172524]
Romero-Bermejo FJ, Ruiz-Bailen M, Guerrero-De-Mier M, Lopez-Alvaro J. Echocardiographic hemodynamic monitoring in the critically ill patient. Current cardiology reviews. 2011 Aug:7(3):146-56 [PubMed PMID: 22758613]
Beigel R, Cercek B, Siegel RJ, Hamilton MA. Echo-Doppler hemodynamics: an important management tool for today's heart failure care. Circulation. 2015 Mar 17:131(11):1031-4. doi: 10.1161/CIRCULATIONAHA.114.011424. Epub [PubMed PMID: 25779543]
Level 3 (low-level) evidenceBeigel R,Cercek B,Arsanjani R,Siegel RJ, Echocardiography in the use of noninvasive hemodynamic monitoring. Journal of critical care. 2014 Feb; [PubMed PMID: 24135014]
Martins MR, Martins WP, Soares CAM, Miyague AH, Kudla MJ, Pavan TZ. Understanding the Influence of Flow Velocity, Wall Motion Filter, Pulse Repetition Frequency, and Aliasing on Power Doppler Image Quantification. Journal of ultrasound in medicine : official journal of the American Institute of Ultrasound in Medicine. 2018 Jan:37(1):255-261. doi: 10.1002/jum.14338. Epub 2017 Jul 24 [PubMed PMID: 28736982]
Level 3 (low-level) evidenceScantlebury DC, Geske JB, Nishimura RA. Limitations of Doppler echocardiography in the evaluation of serial stenoses. Circulation. Cardiovascular imaging. 2013 Sep:6(5):850-2. doi: 10.1161/CIRCIMAGING.113.000575. Epub [PubMed PMID: 24046382]
Level 3 (low-level) evidenceAnavekar NS, Oh JK. Doppler echocardiography: a contemporary review. Journal of cardiology. 2009 Dec:54(3):347-58. doi: 10.1016/j.jjcc.2009.10.001. Epub 2009 Oct 22 [PubMed PMID: 19944309]
Jenderka KV, Delorme S. [Principles of Doppler sonography]. Der Radiologe. 2015 Jul:55(7):593-609; quiz 610. doi: 10.1007/s00117-015-2869-x. Epub [PubMed PMID: 26187613]
Lambert AS. Proximal isovelocity surface area should be routinely measured in evaluating mitral regurgitation: a core review. Anesthesia and analgesia. 2007 Oct:105(4):940-3 [PubMed PMID: 17898369]
Arnold MJ, Jonas CE, Carter RE. Point-of-Care Ultrasonography. American family physician. 2020 Mar 1:101(5):275-285 [PubMed PMID: 32109031]
Seif D, Perera P, Mailhot T, Riley D, Mandavia D. Bedside ultrasound in resuscitation and the rapid ultrasound in shock protocol. Critical care research and practice. 2012:2012():503254. doi: 10.1155/2012/503254. Epub 2012 Oct 24 [PubMed PMID: 23133747]
Chodakowski JD, Courtney DM. Pulmonary embolism critical care update: prognosis, treatment, and research gaps. Current opinion in critical care. 2018 Dec:24(6):540-546. doi: 10.1097/MCC.0000000000000558. Epub [PubMed PMID: 30325344]
Level 3 (low-level) evidenceFeigenbaum H. Role of M-mode technique in today's echocardiography. Journal of the American Society of Echocardiography : official publication of the American Society of Echocardiography. 2010 Mar:23(3):240-57; 335-7. doi: 10.1016/j.echo.2010.01.015. Epub [PubMed PMID: 20206828]
Prada G, Vieillard-Baron A, Martin AK, Hernandez A, Mookadam F, Ramakrishna H, Diaz-Gomez JL. Echocardiographic Applications of M-Mode Ultrasonography in Anesthesiology and Critical Care. Journal of cardiothoracic and vascular anesthesia. 2019 Jun:33(6):1559-1583. doi: 10.1053/j.jvca.2018.06.019. Epub 2018 Jun 30 [PubMed PMID: 30077562]
McKaigney CJ, Krantz MJ, La Rocque CL, Hurst ND, Buchanan MS, Kendall JL. E-point septal separation: a bedside tool for emergency physician assessment of left ventricular ejection fraction. The American journal of emergency medicine. 2014 Jun:32(6):493-7. doi: 10.1016/j.ajem.2014.01.045. Epub 2014 Feb 3 [PubMed PMID: 24630604]
Level 2 (mid-level) evidenceMcLean AS. Echocardiography in shock management. Critical care (London, England). 2016 Aug 20:20():275. doi: 10.1186/s13054-016-1401-7. Epub 2016 Aug 20 [PubMed PMID: 27543137]
Magder S. Invasive hemodynamic monitoring. Critical care clinics. 2015 Jan:31(1):67-87. doi: 10.1016/j.ccc.2014.08.004. Epub [PubMed PMID: 25435479]
Sommer RJ, Hijazi ZM, Rhodes JF. Pathophysiology of congenital heart disease in the adult: part III: Complex congenital heart disease. Circulation. 2008 Mar 11:117(10):1340-50. doi: 10.1161/CIRCULATIONAHA.107.714428. Epub [PubMed PMID: 18332279]