Issues of Concern
Defining Quality
Deming defined quality in business as the delivery of a predictable, uniform standard in services or goods with the standard both suited to and defined by the customer. Although the concept of quality specifies consistency, processes must also adapt to retain quality based on developments in knowledge and external factors. Such factors include new customer demands, the discovery of better practices developed elsewhere, and/or new rules from regulatory bodies. Deming considered quality to involve minimizing costs, but he viewed cost control as an end of other quality management means, not as a means primarily unto itself.
Quality can be defined using the following equation:
- Quality = process outcomes x customer satisfaction, where process outcomes are hard data and customer satisfaction is based on perceptual data
Philosophically and linguistically, it can be argued that cost is irrelevant to quality.
Value, in equation form, can be defined as:
In other words:
Healthcare quality includes all factors contributing to patients' healthcare status and their acceptance of the care received. This includes hard, factual outcomes, such as mortality and morbidity complications, and soft outcomes, such as patient experience. Patients evaluate quality and value based on what they perceive, whether that perception is accurate or inaccurate. Perceived quality depends both on the patient's observations about what input (effort) the HCP makes, what the actual output (outcome) of the care is, and how much (time, money, and effort) they sacrificed to obtain it.
To maximize value, healthcare managers (HCMs) must find ways to increase both the number of positive hard outcomes and softer perceptual measures while decreasing overall costs (see Graph. Average Costs to a Managed Care Organization). Hard and soft quality measures can be studied with respect to certain 'domains' (including effectiveness, efficiency, timeliness, safety, equity, and customer-centeredness) or via other models (such as the one based on the work of Avedis Donabedian, discussed below).[6]
Evaluating Healthcare Quality
Although some persons tout American healthcare as having the highest quality, there is much data to indicate, on the contrary, that American HCPs have much room to improve the quality of their services.
The Commonwealth Fund, which freely reports its data analysis on its website, published its most recent study of eleven first-world countries' healthcare metrics in 2017. The United States placed first in preventing inpatient death after a stroke, tied-for-first in 5-year breast cancer survival, third in preventing inpatient death after a heart attack, and tied-for-third in 5-year colon cancer survival. However, the US placed last in health care outcomes (quality) regarding:
- All the other disease-specific outcomes it measured
- All-cause death amenable to healthcare intervention and
- Every measure of population health.
Thus, unless a person bases their assessment on healthcare outcomes for several isolated disease processes, they should conclude that Americans do not come close to having the highest quality of healthcare in the world.
The American public has approved a healthcare system that incentivizes new, often unproven technology; defensive medicine; and the restriction of healthcare for people under age 65 to employment-related options. Given that this system costs Americans more per citizen by far than systems elsewhere cost citizens of any other first-world country, the value of US healthcare likely does not rank among the top fifty countries in the world.
In the 1960s, following Deming's and Codman's lead, Avedis Donabedian began advocating that healthcare quality managers (HQMs) should quantify healthcare processes in addition to measuring healthcare structures and healthcare outcomes.[4] In other words, Donabedian argued that HQMs should measure behaviors and the completion of tasks (such as the rate of HCP compliance in completing checklists and the time HCPs spend performing specific tasks), in addition to tracking infrastructure items (such as computers available by the bedside and syringes used in a procedure) and patient disease state outcomes (such as morbidity and mortality). He wrote:
Most studies of quality suffer from having adopted too narrow a definition of quality. In general, they concern themselves with the technical management of illness and pay little attention to prevention, rehabilitation, coordination and continuity of care, or handling the patient-physician relationship.
In doing so, Donabedian called for HCPs and HQMs to investigate numerous types of processes involved in healthcare delivery besides just HCP technical proficiency to determine where changes in processes could improve quality. Since Donabedian's writing, the assessment of healthcare quality has often been separated into three primary buckets:
- Structure: resources required to supply healthcare, including human and inanimate physical resources
- Process: methods, behaviors, and strategies
- Outcome: measurable results, which are more of a gold standard barometer than structure or process (see the definition of quality above).
In general, structure measurements evaluate the baseline resource commitments that determine whether or not a health care entity should be delivering care in the first place. Process measurements are often measured as binary (yes/no) measures based on national standards, and outcome measures are usually evaluated as rates.
Care for acute myocardial infarction (AMI) patients is discussed as an example: Structural measurements include how well an emergency department is staffed with HCPs who are acquainted with the diagnosis and initial management of AMI and how well a catheterization laboratory is staffed with HCPs and equipment capable of providing diagnostic and interventional services. Process factors include the behaviors that enable the patient to quickly be sent for coronary artery catheterization, which can be measured in sum as the door-to-wire (patient arriving at the institution to cardiologist crossing the patient's coronary artery lesion with a wire) time or can be measured in smaller divisions of the overall process. A standard for door-to-wire time in the United States has been suggested as 90 minutes or less.[7]
Outcomes, the actual results of care, can be measured as the success rate of opening acute coronary occlusions, the average improvement of cardiac function measured by cardiac output, or the 24-hour death rate (the number of patients with AMIs who die within 24 hours divided by the total number of AMI patients treated).
Many healthcare organizations (HCOs) have heeded Donabedian's call, such as the Commonwealth Fund, the Leapfrog Group, and the National Institute of Standards and Technology. Persons in the US government monitor reports from these groups concerning their data. In the 20th and (primarily) 21st centuries, in response to the data and observation that American healthcare quality lags in many other countries, federal and other institutions began regulating certain facets of healthcare quality delivery.
Obligating Quality From Healthcare Providers
Obligations to provide quality (and value) to patient-customers derive from a hierarchy of standards, listed in subjective order of binding authority:
- Legal standards for healthcare services and billing include statutes passed by legislatures, executive orders declared by the President and governors, and common laws issued by judges.
- National medical organization standards for healthcare services include medical societies and organizations that monitor healthcare facilities, such as TJC.
- Local (e.g., hospital-level) policy standards for healthcare services and billing
- Other ethical norms (e.g., heuristics for ethical decision-making, such as those proposed by Beauchamp and Childress or by Jonsen, Siegler, and Winslade).[1]
Healthcare Quality Standards
National standards in the US are determined by the federal legislature, the federal courts, the President, and the organizations that report to these entities (primarily the President).
Since 1953, the US Department of Health and Human Services (DHHS) has been led by an official who reports directly to the President as a Cabinet member. The DHHS is the executive branch department responsible for the portion of American healthcare that is federally controlled (much of American healthcare is not federally regulated). The DHHS consists of numerous appointed officers (such as the surgeon general) and eleven operating divisions, which include the Food and Drug Administration (FDA), the Centers for Disease Control (CDC), the Centers for Medicare & Medicaid Services (CMS), and the Agency for Healthcare Research and Quality (AHRQ). The AHRQ, which also interacts with the US Congress, oversees a network of Patient Safety Organizations (PSOs) and the Network of Patient Safety Databases (NPSD). It funds the United States Preventive Services Task Force (USPSTF), created in 1984. It makes recommendations on what screening exams improve healthcare quality enough for the US government to pay for them or demand that private insurance companies pay for them. HCPs can submit information about individual patient adverse outcomes and rates thereof to PSOs, which return to HCPs feedback on preventing future patient safety events.
The US Congress creates healthcare laws under the leadership of the Health, Education, Labor, and Pensions Committee in the Senate and the Ways and Means Committee in the House of Representatives. Congress usually creates laws intended to improve healthcare quality in response to reports by other organizations (discussed further below).
The US federal court system has made several decisions that have established national healthcare law, such as legalizing abortion in the first trimester of pregnancy, legalizing the withdrawal of life-sustaining care, and legalizing physician-assisted suicide if previously legalized by state statute. Its standard for evaluating healthcare quality is the language of pre-existing federal law. It has the least impact of the three branches of government in creating healthcare quality pertaining to the concepts of quality promoted by Shewhart, Deming, and Donabedian.
The US executive and legislative branches interact with multiple independent, non-profit organizations when making policies pertaining to healthcare standards. Two examples of such organizations are the National Committee for Quality Assurance (NCQA) and the National Quality Forum (NQF).
The NCQA was founded by Margaret O'Kane in 1990 to publish evidence-based quality standards. It has since become the primary voluntary quality accreditation program for individual physicians, health plans, medical groups, and healthcare software companies. Its two primary contributions include maintaining the Healthcare Effectiveness Data and Information Set (HEDIS) and the Consumer Assessment of Healthcare Providers Systems (CAHPS) survey. Health insurance plans achieve accreditation status by meeting the HEDIS criteria. The NCQA and AHRQ later developed other CAHPS surveys for doctors, nursing homes, long-term care, home health, and dialysis centers.
In partnership with the Hospital Quality Alliance, CMS began using a hospital rating and reporting system (HCAHPS, also sometimes referred to as Hospital Compare) in 2002. The CAHPS surveys are used by health insurance plans, including CMS' Medicare plan, which is the largest American health insurance plan, to obtain patients' feedback about services they have received. Insurance plans can financially penalize HCOs that have poor feedback. Scores from some CAHPS surveys are made publicly available for consumers to use when selecting one HCO or HCP over another.
The National Quality Forum (NQF) is a non-profit membership organization that was established in 1999. It is comprised of over 400 for-profit and non-profit organizations that collect data and endorse healthcare standards. That is to say, the NQF does not, in general, create its own statements on standards but endorses standards set by other entities that then 'increase in legitimacy' as a national standard. Membership organizations include consumers, health plans, medical professionals, employers, government, public health, pharmaceutical, and medical device organizations.
Regulation of Quality in Hospitals and Other Healthcare Organizations (HCOs)
HCOs must undergo periodic reviews and submit data to demonstrate that their HCPs are meeting quality standards to bill federal and state health insurance programs for services. Federal agents can "deem" HCOs to have met quality standards via direct investigation. However, federal and state governments more commonly allow independent agencies that set quality standards (such as Det Norsk Veritas (DNV), the Healthcare Facilities Accreditation Program (HFAP), and The Joint Commission (TJC)), to act on their behalf to create and oversee HCO quality of care standards.
Given the complexity of this topic, this article focuses on TJC standards and does not discuss nuances of non-uniformity in the standards created by TJC, other independent accrediting bodies, and the federal government. TJC publishes standards for HCPs to follow in its Patient Safety System guidelines, last updated in January 2018. The standards are divided into four sections; all sections are titled "LD" (for leadership) followed by .01, .02, .03, or .04 and then followed by an additional set of numbers, such as LD.01.01.01. TJC says that each accredited HCO must:
- Have its leaders create and maintain a culture of safety and quality throughout the organization.
- Be a learning organization (an organization that requires its personnel to learn continuously.
- Encourage blame-free reporting of system and process failures and encourage proactive risk assessments by HQMs.
- Report certain adverse events, close calls, and hazardous conditions to TJC.
- Have an organization-wide patient safety program that includes performance improvement activities.
- Collect data to monitor quality performance.
- Hold persons accountable for their responsibilities. On this point, TJC states: "… a fair and just culture holds individuals accountable for their actions but does not punish individuals for issues attributed to flawed systems or processes."
Ironically, TJC does not hold itself accountable in many regards; it enables the HCOs that it accredits leeway in interpreting TJC standards, such that one TJC-accredited HCO may interpret a standard differently than another, and the two HCOs may use different standards. Furthermore, if a patient or a physician has a complaint regarding a TJC-accredited institution, TJC may refuse to do anything about the complaint if the TJC-accredited institution has made a minimum effort to adopt any standard at all. More than 20% of US hospitals do not report to TJC (i.e., do not follow its standards), which charges a fee for HCOs to become accredited, and either remain unaccredited or choose accreditation from a competing organization.
Regulation and Setting of Quality Standards
Individual state medical boards and court systems uphold standards for HCPs, with medical boards primarily enforcing HCP ethics standards and courts primarily judging issues of HCP negligence in adherence to state laws.
The bulk of healthcare practice standards are not established through the regulatory processes described above but are instead determined by guidelines from national medical specialty organizations. There is much overlap in this process. For example, organizations that publish standards for HCPs who practice in vascular medicine in the United States include the following:
- Society for Vascular Surgery (SVS)
- American Venous Forum (the latter two organizations work in conjunction with the American College of Surgeons (ACS))
- Society of Interventional Radiology (an organization that coordinates with the American College of Radiology)
- American College of Cardiology
These organizations at times interact with each other to set quality guidelines. The organizations may agree or disagree regarding what a standard should be; some facets of vascular medicine quality may be addressed by only one of these organizations.
While not 'regulation' per se, the federal government and private insurance companies incentivize HCPs to meet quality measures through pay-for-performance (P4P) programs that reduce the pay of HCPs who do not meet certain quality thresholds. The Centers for Medicare and Medicaid Services (CMS) current iteration of P4P is the Quality Payment Program (QPP). Most HCPs who bill CMS for services rendered receive payment tied to meeting criteria in the QPP's Merit-based Incentive Payment System (MIPS), which is one of two payment programs through the QPP. MIPS redistributes payments from HCPs who do not meet the criteria to HCPs who do meet the criteria, which are extensive and are listed at: https://qpp.cms.gov/mips/quality-requirements. These requirements involve many types of structures, processes, and outcomes. Over time, CMS has provided HCPs with more flexibility in meeting quality measures while also increasing the overall requirements. Since CMS started HCP P4P in 2006, it has increased the percentage of the revenue tied to P4P criteria that HCPs earn from treating Medicare patients to as high as 10%. This value is likely to continue to increase. CMS and private insurance companies also reimburse hospitals and other healthcare facilities using measures related to quality (P4P).
Healthcare Quality Management (HQM) and Healthcare Quality Managers (HQMs) Standards
Authority for determining standards in HQM per se is even less established and more fragmented than it is for determining standards in medical ethics and medical and surgical care practices per se. HCPs with training in HQM comprise a tiny fraction of HCPs overall, including the HCPs who establish standards of care guidelines in the national societies listed above. Several quality management organizations that do directly impact American HQM are listed below.
The Institute for Healthcare Improvement (IHI) is an independent non-profit organization (and PSO) started in 1991 by Donald Berwick, a pediatrician and lead CMS administrator under President Barack Obama. The IHI is primarily an educational and advocacy organization; it published its Framework for Clinical Excellence in 2017.
The National Association for Healthcare Quality (NAHQ) is an independent non-profit organization established in 1976 that is the only organization that offers a national certification for HQM professionals, and that itself is accredited (by the Institute for Credentialing Excellence).
The American Health Quality Association (AHQA) is a non-profit organization established in 1984 that advocates for HQM standards and encourages participation from third-party healthcare organizations but does not publish standards or guidelines.
The American National Standards Institute (ANSI) is an independent non-profit membership organization established in 1918 that primarily endorses quality standards in technology, including health information technology. It formally serves as the American member of the International Standards Organization (ISO). This independent non-profit organization publishes standards for technology-centered businesses headquartered in Geneva, Switzerland. The ISO advocates for quality improvement using:
- Process-focused approaches,
- Customer-focused outcomes,
- Coordination and engagement of involved persons/parties,
- Data-collection, and
- Evidence-based decision-making.[8]
In summary, the regulation of healthcare quality is fragmented between government agencies, agencies that have been established for determining quality standards for HCPs themselves, agencies that have been established for determining quality standards for HQMs themselves, and other agencies that have their own agendas in healthcare quality.
Having discussed the setting of quality standards by organizations with a nationwide reach, attention is now turned to the process of creating and analyzing healthcare quality.
Terms In Quality Delivery
The field of quality management (QM) has its own terminology, some of which derives from Japan, where Deming and others practiced QM to enable Japanese companies to start manufacturing goods and services, such as cars and electronic devices, with higher quality than those produced in the United States after World War II. Because QM is a branch of applied statistics and research, many concepts and terms derive from those fields, e.g.:
- Continuous (also known as variables or quantitative) data vs. categorical (also known as attributes or qualitative) data types
- Gaussian data distribution vs. Poisson, polynomial, or skewed data distributions
- Relative risk, effect size.
Adroitness in the practice of QM requires a grasp of statistics that will not be discussed here. Instead, quality management terms will be introduced. The reader is advised to consult more comprehensive texts on quality management and statistics for more details on terminology and applications within the field.
Retrospectively Analyzing Causes (Independent Variable)
Persons performing QM spend a large amount of effort analyzing all the steps in a process looking for kaizen (opportunities for improvement). In performing this task, they often create lists and charts, many types of which are briefly explained below.
Suppler-input-process-output customer (SIPOC, also known as COPIS) charts divide the components of a process into five components that must be considered when determining how to improve the process to achieve quality in the customer's eyes.
Gap analysis is the process of identifying where specific barriers in a process can be removed. The details of why present outcomes differ from desired outcomes are explored. Persons often communicate during gap analyses using a flow chart.
Flow charts illustrate how individual processes affect a larger overall process. Flow charts can aid a subjective evaluation of which individual processes can or should be improved to prevent errors and variation in outcomes or should be eliminated to reduce waste. A fishbone diagram, also called an Ishikawa diagram, is a flow chart designed to facilitate the analysis of causes and effects. Instead of organizing a complicated process linearly where each individual factor or process leads to another that leads to another, individual contributing factors are grouped into larger categories.
Aristotle provided an example of classifying causes in this method in his books Metaphysics and Physics by defining four causes of any one thing:
- Efficient cause (its maker)
- Final cause (its teleological purpose)
- Formal cause (its design)
- Material cause (its substance)
Modern attempts at classifying causes include such alliterations as 'patron/patient, people at work, provisions, place, and procedures' and 'methods, men, machines, and materials.' Fishbone diagrams are often used by HQMs and HCPs when discussing causes of adverse patient outcomes during root cause analyses (described below).
The causes of problems can be anticipated, or they can be reacted to; different QM techniques are available for anticipation or reaction, such as failure modes effects analysis (FMEA) and root cause analysis (RCA), respectively.
FMEA is a method to design or redesign a process in anticipation of problems. Quality management:
- Lays out a complex process as a flow chart or as a table broken into individual sub-processes
- Defines how frequently each sub-process tends to be problematic
- Elucidates the various manners by which the sub-processes can fail, and
- Assesses how easily a minor problem in a process can be detected before it results in a serious adverse outcome.
The sub-processes that fail often, are easy to fix, and are difficult to detect before resulting in a catastrophe are the ones that should be prioritized for correction to improve the overall process and outcome.
Root Cause Analysis and Action (RCA2, or just RCA) works backward from an outcome (usually an unwanted outcome, but the outcome could be the desired outcome) to its "root" causes, stopping short of reaching the unmoved mover postulated by Aristotle in the Metaphysics. RCAs at HCOs are usually held as meetings involving all persons identified as having a role in processes that led to the outcome. The primary function of an RCA is to identify gaps between the expected process/outcome/structure and the actual process/outcome/structure. RCA can be facilitated using Ohno and Sakichi Toyoda's 5 Why's Technique and James Reason's Swiss cheese model.[9] In 2015, the National Patient Safety Foundation (which merged into the IHI in 2017) published its opinion on when and how RCA should be performed in the medical setting. CMS published on its website instructions for HCPs on performing RCAs. TJC requires its accredited HCOs to perform RCAs whenever one of twenty-four types of adverse events (called sentinel events) occurs.
The techniques discussed thus far do not in and of themselves require the use of data. Objectivity in analysis can be improved by using data. HQMs can increase data capture for actions not captured automatically by electronic health records (EHRs) by having HCPs document processes they are involved with using checksheets or checklists (which can be converted into checksheets and uploaded into the EHR as needed).
The quality of evidence-based on the quality of data collection and analysis is categorized by the Oxford Centre for Evidence-Based Medicine (OCEBM) and the Grading of Recommendations Assessment, Development, and Evaluation (GRADE) levels of evidence. OCEBM lists five levels, whereas GRADE lists four levels. Level 1 evidence is a randomized controlled trial or meta-analysis of randomized controlled trials. GRADE emphasizes that data evaluation based on meta-analyses may be no better than analysis of isolated studies. Unlike OCEBM, GRADE also does not consider experts' opinions to qualify as a level of evidence.
Although QMs should make decisions based on the relative quality of evidence available, it is not feasible for QMs to perform randomized controlled trials or cross-sectional studies in most circumstances. QMs can use other tools, such as histograms (or other bar charts) and scatter diagrams, to detect trends and relationships between independent and dependent variables when data is available in day-to-day practice. For categorical data, a Pareto chart (a type of bar chart) can be created from the data to determine the priority in 'where the cause is' for a problem. In other words, a Pareto analysis orders the categories of data to show which category or categories are most associated with an outcome of interest.
Categorical and continuous data can be analyzed retrospectively with a moderate passage of time between the time of events and the time of their evaluation. However, quality improvement can (and should) be performed using prospective data collection to allow evidence-based decision-making as quickly as possible (in real-time or near-real-time). In the health care industry, patients' lives are at stake.
Analyzing Processes In Real-Time To Detect And Modify Causes (Independent Variables)
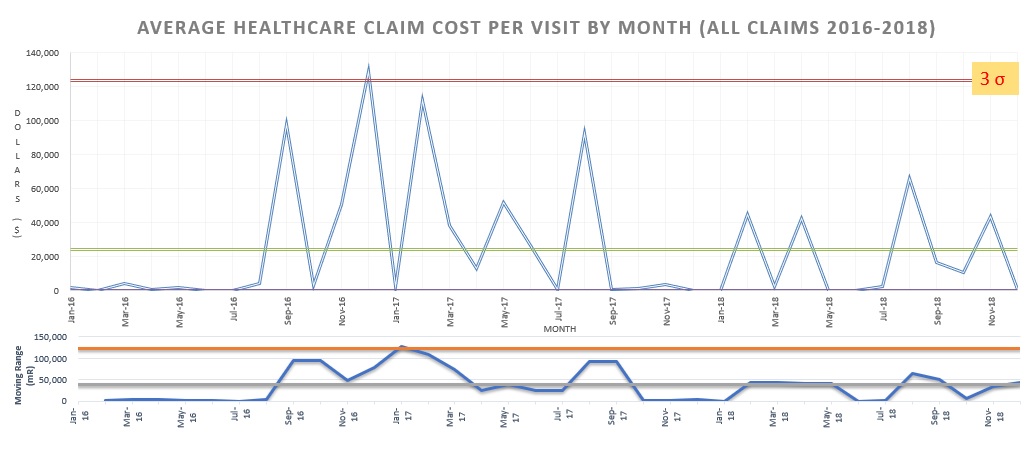
Processes can be monitored in real-time or near-real-time when collecting data by comparing outcomes in two different groups (control and experimental groups) or by comparing outcomes in one group both before and after an intervention. The data can be presented in table format or by plotting the input and/or output variables over time in various types of line charts, particularly run charts and SPC charts (see figure).
A run chart is a line chart that enables the collected data points to be compared to a measure of the central tendency (usually the data's mean) that the data have had in the past up to the most recent data point collected. Run charts can be used to evaluate fluctuations in categorical or continuous data (usually the latter) so that quality managers can quickly identify when a process has recently begun to deviate from the past trend. This allows the quality manager to attempt corrective action when a trend is undesired or to evaluate whether a manager's recent corrective action has resulted in a new desired trend. Shewhart devised a way to convert a run chart into a more specialized illustration of a process trend once enough data had been collected to enable a statistical analysis of data variation from the measure of central tendency.
In other words, statistical process control charts (also called SPC charts, control charts, or Shewhart charts after their inventor) are run charts that require some additional statistical manipulation. SPC is the method most commonly used by QMs to make data-driven decisions with a degree of statistical certainty about processes at their institution. Therefore, it is given some attention in detail here, although actual steps for incorporating SPC into clinical practice are not discussed.
SPC charts used in clinical practice usually provide a threshold of statistical 'certainty' for determining when data points diverge from the measure of central tendency called a control limit or a process limit. When the threshold is breached, the quality manager should search for the new disruptive independent variable (termed special cause variation). A small variance in the data not reaching a high degree of statistical probability should be accepted as being due to prior fluctuations in the already established independent variables (termed random variation or common cause variation). Data analysis using SPC charts enables decision-making using a 'level of evidence' equivalent to a non-randomized, incompletely- or non-matched prospective cohort study.
In both types of comparison, relative risks and effect sizes can be determined, although their values will be incompletely reliable due to bias and confounding variables. In a stable population of patient-customers, such as those who undergo return visits to a clinic (e.g., patients with peripheral arterial disease returning for medical or other rehabilitative non-invasive therapies), data can be obtained pre-intervention and post-intervention on the same patient-customers. This enables a crossover study format with patient-customers acting as their own true controls without interrupting the clinic business operation, such as increasing costs for new patient-customer recruitment. Given that making evidence-based interventions to improve outcomes is the primary goal of HQM (not achieving statistical certainty), analysis of internal organization data using SPC charts can help accomplish that goal in most circumstances.
SPC requires the user to select from many different chart subtypes, each designated for a specific use depending on the properties of the data being collected. SPC charts used in clinical practice usually incorporate the data's standard deviation as a value moving across time and compare the actual data to values that would be expected in a Gaussian distribution (i.e., a bell curve).[10] Determining how the actual data's distribution differs from a Gaussian distribution can be a relevant step in the analysis (and can facilitate selecting the best SPC chart to use). However, SPC charts can detect nonrandom process outcomes without the chart creator having first to verify that assumptions of models based on Gaussian statistics are met. SPC charts are also more effective for use when one or more problems and the manner for collecting data about the problem(s) have already been established. When the problem(s) or the cause(s) of the problem is(are) not known, then the QM should instead use flow charts, Pareto charts, probability plots, scatter diagrams, histograms, and/or affinity diagrams to guide the initial quality improvement measures.
In theory, all HQMs should:
- Collect data on all possibly relevant independent variables pertaining to the processes for which they are responsible for maintaining quality and that are amenable to statistical analysis.
- Perform statistical analysis using confidence levels and confidence intervals.
- Monitor all recurring processes where corrective managerial actions are time-sensitive by performing run charts for those processes.
- Switch from run charts to SPC charts for processes that are meet the theoretical criteria for appropriately interpreting the SPC chart.
Of the many goals that HQMs and HCPs should have with respect to the above-described techniques, the discussion will further center around the following four:
- Achieving uniformity,
- Increasing efficiency,
- Preserving patient safety, and
- Focusing service whenever ethically possible on the desires of those being served (i.e., respecting patient-customers).
Achieving Uniformity In Desired Results
Efficacy is the ability of an intervention to achieve desired results; reliability is the ability of an intervention to achieve desired results consistently. When a threshold level of desired results is based on a reference standard, the reference standard is a benchmark. This term derives from a technique used by geographic surveyors to ensure that when they return to a place to obtain new measurements, they can be obtained and compared reliably with the old measurements. A benchmark can be derived from any organization that achieves quality level reliability. Organizations that collect data on achieving benchmarks may offer it for free public use, such as CMS on its Hospital Compare website, or for a price, such as the Milliman company's data for HCOs.
Engineer Bill Smith, working for Motorola in the 1980s, advocated using PDSA cycles and SPC charts to reduce variability in telecommunications products and services. Smith's goal was to achieve less than 3.4 defects per million iterations of a process (which means that a defect occurs with a probability distributed at least six standard deviations (six sigma) from the mean of a Gaussian distribution). Healthcare also uses products and processes that can achieve defects at extremely low rates, but because biological organisms (patients) do not respond in uniform manners to interventions as many inanimate objects do, services and outcomes to patient-customers must be tailored to a greater degree to respect patient autonomy. Outcomes can be expected to vary to a greater degree than can be achieved for processes involving inanimate objects.
Uniformity is, in part, achievable by following standards of practice published by medical specialty organizations. Quality managers attempting to fine-tune processes to reach benchmarked outcomes reliably can use run charts to reliably identify causes of process progression toward or away from achieving the benchmark.
Deming's definition of quality does not exclude tailoring services. Deming worked in fields where uniformity in output was not subject to the ethical issue of patient autonomy or the practical issue that patients are sharing. A particular disease state may differ in other factors that require individualization in the approach to disease management. A significant challenge in HQM is achieving reliability in the face of extreme baseline variation in the factors under consideration. For example, quality measurements for individual HCPs should include adverse outcome rates, but the data analysis must account for confounding variables that increase the likelihood of adverse outcomes. Measures of healthcare provider quality should also be based not only on performance metrics that vary depending on differences in input variables but also on attaining uniform credentials, such as board certification.
Nevertheless, in healthcare services, as in other businesses, uniformity in services with the standard suited to the patient-customer is ideal. Uniformity in providing healthcare services and products indicates that each patient-customer is receiving the best possible service or product under routine circumstances and enables HCPs to fulfill the ethical obligation of distributive justice as described by Beauchamp and Childress and as specified by-laws (such as the Emergency Medical Treatment and Labor Act of 1986 and the Fourteenth Amendment to the US Constitution).
Reducing Waste/Improving Efficiency
An area in which American healthcare quality lags behind other first-world countries is minimizing waste. The Commonwealth Fund reported in 2017 that the US placed tenth out of eleven first world countries on the metric "Doctors ordered a medical test that the patient felt was unnecessary because the test had already been done (recently)." When HCPs require patient-customers to undergo repeat medical tests when the customer has not agreed that repeating the test is valuable to the customer, then Deming's definition of quality is not fulfilled. In 2012, Berwick reported on six categories of healthcare waste:
- Overtreatment,
- Failures of care coordination,
- Failures in the execution of care processes,
- Administrative complexity,
- Pricing failures, and
- Fraud and abuse
Berwick reported that a conservative estimate of the cost of these practices in the United States exceeds 20% of total health care expenditures, that the "actual total may be far greater," and that these practices cost US taxpayers in the 10s to 100s of billions of dollars each year.[11]
Different QM gurus categorize wastes differently. One classification scheme to categorize waste the seven-point Lean classification devised by Ohno, or its modification to eight points, six of which are excesses and two of which are insufficiencies, memorable by the mnemonic TIM U WOOD:
- Excess transportation - T
- Excess inventory - I
- Excess motion - M
- Underuse of talent – U
- Excess (wasted) time – W
- Excess processing/over-perfecting - O
- Excess production/overproduction - O
- Underperformance/defective action - D
Regardless of how waste is categorized, each category serves as a potential area of investigation for a quality manager to improve in their own setting. Several of the above-listed categories are discussed briefly here.
Overtreatment is a common problem in medicine, where physicians are financially incentivized to recommend invasive procedures that have not been shown to outperform less invasive therapies. Examples include:
- Performing services that have short-term benefits that do not outweigh long-term costs,
- Performing services when watchful waiting achieves outcomes that are just as good or better, and
- Performing services for patients who do not truly want them but accept them because of external pressure by HCPs.
Healthcare is filled with service bottlenecks for patient-customers to squeeze through that waste time; HQMs can improve services times and inventory supply and demand by borrowing methods from many other industries that outperform healthcare in time minimization for customers, such as kanban (meaning billboard) techniques used by air traffic control officers in the airline travel industry. HQMs can use Gantt charts to reduce incoordination and duplication of efforts among HCPs working on the same project to save time and effort.
Human factors engineering (HFE) strategies are methods for tailoring job tasks to better match the ability of the person performing them to make tasks as easy as possible to perform. HFE strategies can reduce wasted motion and time and make human actions more reliable and poka-yoke (mistake-proof). An example of this in vascular medicine is designing coaxial sheaths, dilators, catheters, guidewires, and stopcocks in a system that has seamless interchangeability of items without the ability for HCPs to connect or interchange the tools improperly.[12]
Clinical Significance
One of the problems in HQM is that the legal and ethical responsibilities for patient care and the management decisions for care are often not performed by the same persons, and there are conflicts of interest concerning these decisions. HQMs who are not simultaneously HCPs are incentivized to increase efficiency and reduce cost. However, increased efficiency in the service of human beings often does not translate to increased effectiveness. As discussed in the Defining Quality and Value section above, quality and value depend on patient-customer outcomes.
Any HQM who, for the sake of efficiency (or cost reduction), sacrifices service features designed to preserve person-centered care and/or patient-customer safety is gambling with the patient/customers' health and potentially worsening the quality (or value) of the service.
Safety
The US executive and legislative branches together update laws designed to improve patient safety, such as the Healthcare Research and Quality Act of 1999, which led to a report generated by the US Institute of Medicine (now called the National Academy Medicine) called To Err Is Human: Building a Safer Health System.[13] The report found that safety errors kill hundreds of thousands of Americans yearly. The Patient Safety and Quality Improvement Act of 2005 established the NPSD described above. In 2007, the AHRQ developed its healthcare of Safety Indicators. In 2008, CMS began penalizing HCOs for allowing some outcomes listed by the NQF as never events. This list of events, most recently updated in 2011, includes 29 types of events. CMS uses the NQF's list of never events as denial for services paid for some of the events. Numerous other organizations promote safety standards in the US, such as TJC, which publishes a list it calls the National Patient Safety Goals (NPSGs) that change yearly.
Despite the mandates and penalties by government and non-governmental organizations, and despite more data available and general awareness in the 21st century than ever before that HCPs' failure to conduct best safety practices results in human death, American HCPs and HCO managers collectively have not changed much in their attitudes or behaviors. As of 2018, HCP safety errors were still estimated to comprise the third leading cause of death in the United States.[14] As healthcare complexity increases (with sub-specialization of caregivers, barriers to sharing of medical information, an increasing number of drugs and medical devices, and an increasing number of policies on standards), so do the opportunities for safety violations.
Despite a mandate from TJC (most recently in 2017) for HCO managers to establish a "culture of safety" in their HCO and HCO managers advertising that they and the people in their organizations have done so, the medical error data serves as strong evidence that HCOs often still lack a "culture of safety," which overlaps with the concept of a "just culture." According to TJC, in such a culture:
- All HCPs prioritize patient safety over other business factors, such as the cost and time to complete tasks. According to TJC, HCO employees should undergo testing on their understanding of safety measures using a validated testing procedure every 18 months.
- The organization's leaders promote, reward, and 'champion' the attitude and behaviors that create such a culture. According to TJC, this includes 1) carrying out a nonpunitive approach to reporting and 2) learning from adverse events, close calls, and unsafe conditions. NQF also has consensus standards for how HCO leaders, HQMs, and HCPs should respond when there is an adverse event.
HCOs with such a culture adopt practices and technologies approved/endorsed by the organizations mentioned above and from published quality research, particularly level 1 research. The effect of a culture of safety on HCO revenue is difficult to measure, but it likely saves HCOs money. For example, employees at such HCOs tend to have high job satisfaction and low turnover, and patient-customers are more likely to return for business and less likely to file suits and complaints that lead to fines.
Organizations should apply poka-yoke (mistake-proofing) measures to every possible process related to patient care, as well as red rules, which are rules that must always be followed to the letter of the policy and can be used by any employee to stop a patient care process that is not being performed according to pre-established standard procedure. As the managers of the Toyota Production System established, the employees who are performing the tasks are often the best persons to identify the features of the system that result in errors (and, by extension, hazards to patient safety).
Patient-Customer Centered Care (Also Called Person-Centered Care)
In general, from an ethical, legal, and business standpoint, patient needs should prioritize the needs of all other stakeholders in the healthcare process. In real life, however, when there is a conflict in goals between the patient-customer and the business or HCP, persons working in healthcare often de-prioritize patient-customer goals. Healthcare managers and HCPs can better serve patient-customers by learning their objectives, aligning business goals with patient/customers' goals when it is ethically and legally appropriate to do so, and by 'activating' patient-customers.[15] Activating customers means enabling them to manage their own service transactions by increasing their knowledge, skills, and options for self-management of services. Activated patients have been found to achieve better clinical outcomes than patients with similar characteristics who were not 'activated.'[16][17]
It is true that each patient is different and has different preferences for decision-making control in different circumstances. Nevertheless, in Western culture, empowering patient-customers to make decisions independently or with their pre-established trust network of family or friends generally results in equal or improved patient-customer outcomes and satisfaction compared to treating patient-customers with paternalism and limiting their options. A Cochrane Database systematic review of 115 controlled studies representing 34,444 research participants reported that providing patients with decision support tools:
- Improves patients' knowledge regarding their medical care options,
- Improves the accuracy of their perception of possible benefits and harms,
- Increases the degree to which they engage in decision-making,
- Reduces HCP-patient decision conflicts, and
- Increases the likelihood that patients choose treatments that are consistent with their value.[18]
The list of methods for improving patient-customer-centered care is lengthy. According to data reported on Statista.com, approximately 90% of Americans use smartphones. Therefore, just one way patient-customer centered care can be achieved in the modern world is digitizing and automating patient communication. HCOs can enable patients to communicate with them using an encrypted electronic 'patient portal.' Using technology in this way can:
Allow patent customers to access portions of or all their medical records, including medical images, enable patient-customers to submit photographs they have taken of their physical appearance (e.g., varicosities, wounds, and other dermatologic abnormalities) into their medical record, provide patient-customers with internet links to freely available pertinent medical literature, including patient or practitioner level information produced by national medical societies which they can review before, during, and/or after their visit for healthcare services.
Give patient-customers access to an online scheduling platform where they can initiate appointments based on currently listed availabilities (which can then be approved or modified by a nurse or other HCP through a traditional triage system), and grant patients with a 24-hour means of communication that enables them to send information to their HCP at any time of day that can then be reviewed at the HCP's own time. This can more quickly enable return instructions to the patient customer compared to a 20th century model of requiring the patient-customer to call only during regular business hours and then wait on hold to speak with a designated person who can provide the same 'secretarial' transmission of information to the physician or other designated HCP.
Enhancing Healthcare Team Outcomes
Teams and Systems
About corporate liability, jurist Joel Prentiss Bishop [from New Comments on the Criminal Law Upon a New System of Legal Exposition. (1892) § 417, 255–56.] wrote:
Since a corporation acts by its officers and agents, their purposes, motives, and intent are just as much those of the corporation as are their actions taken. If, for example, the invisible, intangible essence or air which we term a corporation can level mountains, fill up valleys, lay down iron tracks, and run railroad cars on them, it can intend to do it. It can act therein as well viciously as virtuously.
Just as logic exists for attributing bad business practices and outcomes to corporations themselves and not just to individuals, it exists for attributing bad healthcare services (acts of commission or omission) and outcomes to teams and systems in addition to individual health care providers (HCPs).
Successful healthcare continuity depends on good communication. Inadequate communication often results in fragmented care, which leads to procedural complications, hospital readmissions, and declines in patient functional status, especially for patients with high baseline risks, such as patients with chronic and/or complex illnesses. The Joint Commission (TJC) reported that it was made aware of 2378 sentinel events in the United States in 2014, and it divided those events into categories of causes. The top three categories were:
- Mistakes attributed to individual persons not pertaining to leadership (547)
- Mistakes attributed to leadership errors (517)
- Mistakes in communication, not otherwise specified (489)
Despite this assessment, even TJC, along with many other organizations and individuals in the quality profession, have taught that the root cause of 'the majority of problems in business is most appropriately attributed to the inadequacy of a process, team, or system and not primarily on the inadequacy of an individual.
The odds of achieving quality improvement success can increase with well-functioning multidisciplinary teams compared with individuals working independently. Collaboration may expand the range and depth of expertise applied to a problem. One or more persons who are directly involved with or closest to the performance of the process of concern should always be on the team. Healthcare quality managers should seek input from all persons in the chain of service delivery. Inefficiencies not apparent to one person or a group of persons in the process chain may be raised by others elsewhere. Inefficiencies that are observed but cannot be corrected by one person due to that person's lack of power can be corrected by a person on the team with more power. The managerial approach behind Lean, as used by the Toyota company, emphasizes:
- Hoshin (direction), which is managers introducing changes only after having received input from the lowest-ranked employees, and
- Gemba (actual place) is managers making decisions based on direct contact or observation with the process and not third-party reports discussed in conference rooms. Managers can maximize quality improvement potential in the organization by empowering their employees.
For healthcare quality management to become as advanced as QM in other professions, and for America to catch up to other countries (and achieve Donabedian's goals) in providing healthcare, persons and organizations that have might (as in 'might makes right') must set higher-level standards, e.g.:
- The policy writers of TJC could require that hospitals conduct certain numbers or types of PDSA cycles to maintain accreditation. Or executives in a healthcare organization with a reputation for excellent healthcare quality could require that their managers conduct certain numbers or types of PDSA cycles and set the bar for other HCOs.
- Government officials could require healthcare managers to pass examinations where they demonstrate knowledge and skills to receive accreditation in QM (just as persons in many healthcare professions must).
Reaching Consensus And Prioritizing Efforts At Quality Improvement
QI teams should always analyze data. Because of differences in bias, even in the presence of data, disagreements regarding the best courses of action are inevitable. In addition to standard voting techniques, modified voting techniques are available that promote a course of action that can be most acceptable in a utilitarian manner. The nominal group technique (NGT) combines anonymous brainstorming (each person generates ideas independently) and voting. NGT limits discussion (i.e., back and forth debating) and emphasizes moving forward with a decision based on previously held beliefs. Multi voting (multi-round voting) enables a sequential, progressive narrowing of choices. Once one round of voting is performed, the options receiving the least votes are removed. Additional rounds of voting are performed until the best option or until a prioritization of options is reached. The Delphi method combines multi-voting and NGT. This method enables reaching decisions that have 'general support' by all members.
Voting is usually stopped when necessary to maintain all voters' favor regarding a statement without requiring overly specific conclusions backed by unanimous agreement. Reaching consensus using these techniques improves teamwork and team member engagement more than decision-making strategies based on 'the majority rules' or 'might makes right.' Prioritizing which options are most important when they entail factors competing for attention is challenging. Tools exist that use objective measures to narrow a list of possible choices to one or several choices, including weighting by ranking, value stream mapping, and creating prioritization matrices.
Weighting by ranking goes by various other names and has multiple permutations. It generally involves deriving a rank or hierarchy of scores (values that are measured or calculated but are not entirely arbitrary) for categories of concern (such as tasks, costs, or other attributes). Different options that share these features can be compared using their performance in the different categories in a spreadsheet to determine the best option. For example, determining what method to use to inform patients of post-operative appoints may involve a decision of three options, such as sending a letter through regular mail, sending a text message, or calling by telephone. The categories of concern may include cost, time, and likelihood of receipt. The categories can be given weights of importance, and the options can be ranked according to their overall score across all three categories.
Value stream mapping (VSM) is a decision tool that uses weighting by ranking and is often displayed as a flow chart. In VSM, sub-processes of a larger overall process are assigned weighted values based on relative levels of importance, and which are summed into a final score called a criticality index that determines which process is the most critical for concentrating effort and devoting resources. Common components of a criticality index are:
- The frequency of the problem (how often during iterations a particular activity/task/issue occurs on a critical path),
- The severity of the problem, if or when it occurs, and
- The ease of detection of the problem early on before it becomes unmanageable.
Prioritization matrices are tools that display options along multiple axes (e.g., X, Y, and Z) of competing interests (e.g., time vs. money; or the interests of upper management vs. mid-level management vs. non-management level employees) and plot options or problems according to their importance along each axis. Prioritization matrices are usually drawn in a two-dimensional format in a spreadsheet and assigned scores using weighting by ranking; in this fashion, numerous options or categories (more than just two or three) can be prioritized. Healthcare managers can prioritize quality improvement projects under the following non-mutually exclusive categories:
- Improving service
- Improving safety
- Reducing cost
- Maintaining a competitive edge