Continuing Education Activity
Perimetry is a widely used diagnostic tool that helps assess glaucoma, optic neuropathies, posterior segment disorders, and conditions affecting the visual pathway. It also helps in monitoring the progression of diseases and guiding the treatment. It helps in the measurement of the extent of the visual field loss. This activity outlines the role of perimetry in the diagnosis and follow-up of various conditions affecting the optic nerve, retina, and visual pathway, and it highlights the role of the interprofessional team in evaluating the perimetry reports and thus improving the care of patients undergoing this procedure.
Objectives:
- Review the technique and various strategies available for performing the perimetry test.
- Identify the indications for performing a perimetry test.
- Describe the technique of reading and interpreting a perimetry report.
- Explain the typical perimetry patterns associated with various conditions and the role of interprofessional collaboration in improving the management and outcomes of patients undergoing perimetry.
Introduction
Perimetry is an important diagnostic tool to identify and measure the extent of defects in the visual field. It helps in diagnosing glaucoma and assessing the progression of glaucoma.[1] This article discusses the process of perimetry and the interpretation of the visual field printouts (Humphrey visual field Analyzer). The history of visual field analysis dates back 2000 years, when Hippocrates first reported a case of hemianopsia.[2]
Successively, Ulmus was the first to publish the first illustration of visual fields. Albrecht von Graefe was the first one to publish visual field defects that are characteristic of glaucoma as known today. However, he attributed the field defects at that time to amblyopia due to a lack of knowledge about glaucoma. Landesberg was the first to describe the arcuate defect of glaucoma.[3] The field defect corresponds to the arcuate-like arrangement of the axons emerging from the optic disc.[4]
Jannik Bjerrum used a tangent screen to map the details of the central 30° diameter of the visual field. In subsequent years, Hans Goldmann developed a bowl perimeter that provided a uniform background illumination and a moving optical projection system that could superimpose bright stimuli on the background. Later, Franz Fankhauser, Drs. John R. Lynn and George W. Tate were the first ones to automate the process of perimetry.[5]
Procedures
Visual field: The visual field is the extent of an area visible to an individual during steady fixation of the eye in any one gaze or direction. Harry Traquair defined it as "an island of vision surrounded by a sea of blindness," also known as the hill of vision, considering its three-dimensional aspect. The apex of the hill of vision is the area with the highest retinal sensitivity and represents the fovea. The sensitivity decreases as we move to the periphery of the retina.
The extent of a uniocular visual field was given by Thomas Young.[2] This consists of the central 30 degrees field and extends to 60 degrees superiorly and medially. The temporal extension is up to 100 degrees, and the inferior extent is up to 80 degrees. Binocular visual fields extend temporally to 200 degrees with a central overlap of 120 degrees. Mariotte was the first one to report that the physiologic blind spot corresponds to the location of the optic disc.[2] The blind spot is located 10 to 20 degrees temporal to the point of fixation.
Measurement of visual field or perimetry: The measurement of the retina's sensitivity to light is shown at a given location in the visual field printout. The sensitivity of the retina of a healthy individual is highest at the fovea and then reduces towards the periphery.[6]
The intensity of the light stimulus is measured in apostilb. However, apostilb and retinal sensitivity are inversely proportional to each other. Also, the human eye responds to a wide range of apostilbs. Therefore, the sensitivity to light is measured in decibels (0-50 in standard automated perimetry). Decibel is the logarithmic representation of the intensity of the light stimulus. It has a direct correlation to the sensitivity of the retina. Zero decibels (dB) represent the brightest light stimulus, and 50 dB represents the dimmest stimulus. So a zero decibel stimulus will be visible to a point on the retina with the lowest sensitivity and vice versa.
The decibel value is relative, so it varies from machine to machine. A 0 dB reading represents 10000 apostilbs on the Humphrey visual field analyzer, whereas it represents 4000 apostilbs on the Octopus perimetry. A 40 dB reading represents one apostilb on the Humphrey visual Analyzer, whereas it represents 0.4 apostilbs on the Octopus perimetry.
Threshold: It is the intensity of the light stimulus, which, when presented at a particular location, "n" number of times is detected by the corresponding retinal point at least 50% of the time.
The threshold is measured by using the staircase method "4-2-1". There can be two ways to use this method. If the initial stimulus is not seen, then the intensity of the stimulus is increased by 4 dB steps until it is seen. Once it is visible, the intensity is reduced by 2 dB steps till it is again not visible. Then the intensity is increased by 1 dB till again it is visualized. This final dB reading is the threshold.[1]
Alternatively, the intensity of a seen stimulus is reduced by 4dB till it is not visible. Then the intensity is increased by 2 dB till it is seen, and then the intensity is reduced again by 1 dB till it is not seen.
If the threshold at each retinal point was evaluated in 1 dB steps, it would take a lot of time, and the process will tire out the patient easily. Therefore the staircase method is used.
Kinetic perimetry: The test is actively performed by the examiner where they move the target on an arc, and the patient responds by localizing the target when it enters the visual field of the patient. In this test, the intensity of the target remains the same throughout the test, whereas the color or the size of the stimulus can vary. So this test is useful in assessing the two-dimensional extent of the visual field. The commonly used kinetic perimeter is the Goldmann perimeter.
Static perimetry: This test is automated.[7][8] The machine presents a stimulus of a particular size but with varying intensity at various locations in a bowl perimeter. The patient responds by pressing a button when they visualize the particular stimulus. The size is constant for one particular test but can be changed between tests. This test measures the depth of the defect at various locations in the visual field. The commonly used static perimeters are the Humphrey and the Octopus.
Strategy: These are testing algorithms used so that the test does not take too much time and the results are not affected by the patient's fatigue.[9] For example, full threshold, SITA (Swedish interactive thresholding algorithm) standard, and SITA FAST are the different strategies available on Humphrey.[10][11][12]
Program: To reduce the time taken for the test and to enable the patient to carry out a test more attentively, a limited number of points on the retina are checked for their retinal sensitivity. The location and the pattern of the points tested on the retina are decided by the different programs available on the machine. For example, 30-2, 24-2, 10-2, and the macular program are available on Humphrey Field Analyzer (HFA).[13]
The 30-2 tests the central 30 degrees field of the retina with fovea as fixation. This gives a round printout with 30 degrees around the fovea (the radius of the field is 30 degrees). The digit 2 in this test denotes that the points are not located exactly on the vertical or horizontal midline (points are located at the midline in the 30-1 test in the HFA-1 machine). Instead, the points are equidistant from this line. This helps to better document the visual fields obeying the horizontal midline (glaucoma) and vertical midline (visual pathway lesions).
A total of 76 points are tested on the retina, with each point at a distance of 6 degrees from the other in the 30-2 test. This leaves a bare area between the points. This bare area is a circle with a radius of 3 degrees between any four points. This bare area remains unevaluated.
The 24-2 test is a subset of 30-2 where the outermost points are eliminated, retaining two nasal points (specifically to look for nasal steps in glaucoma). It tests 54 points. This may be a better program for the elderly as it reduces the time taken for the test. It also reduces the number of false negatives due to the patient's fatigue, as the outer points are the last ones to be tested. Also, the points eliminated from the 30-2 field are not considered when diagnosing glaucoma. The distance between any two points remains 6 degrees.
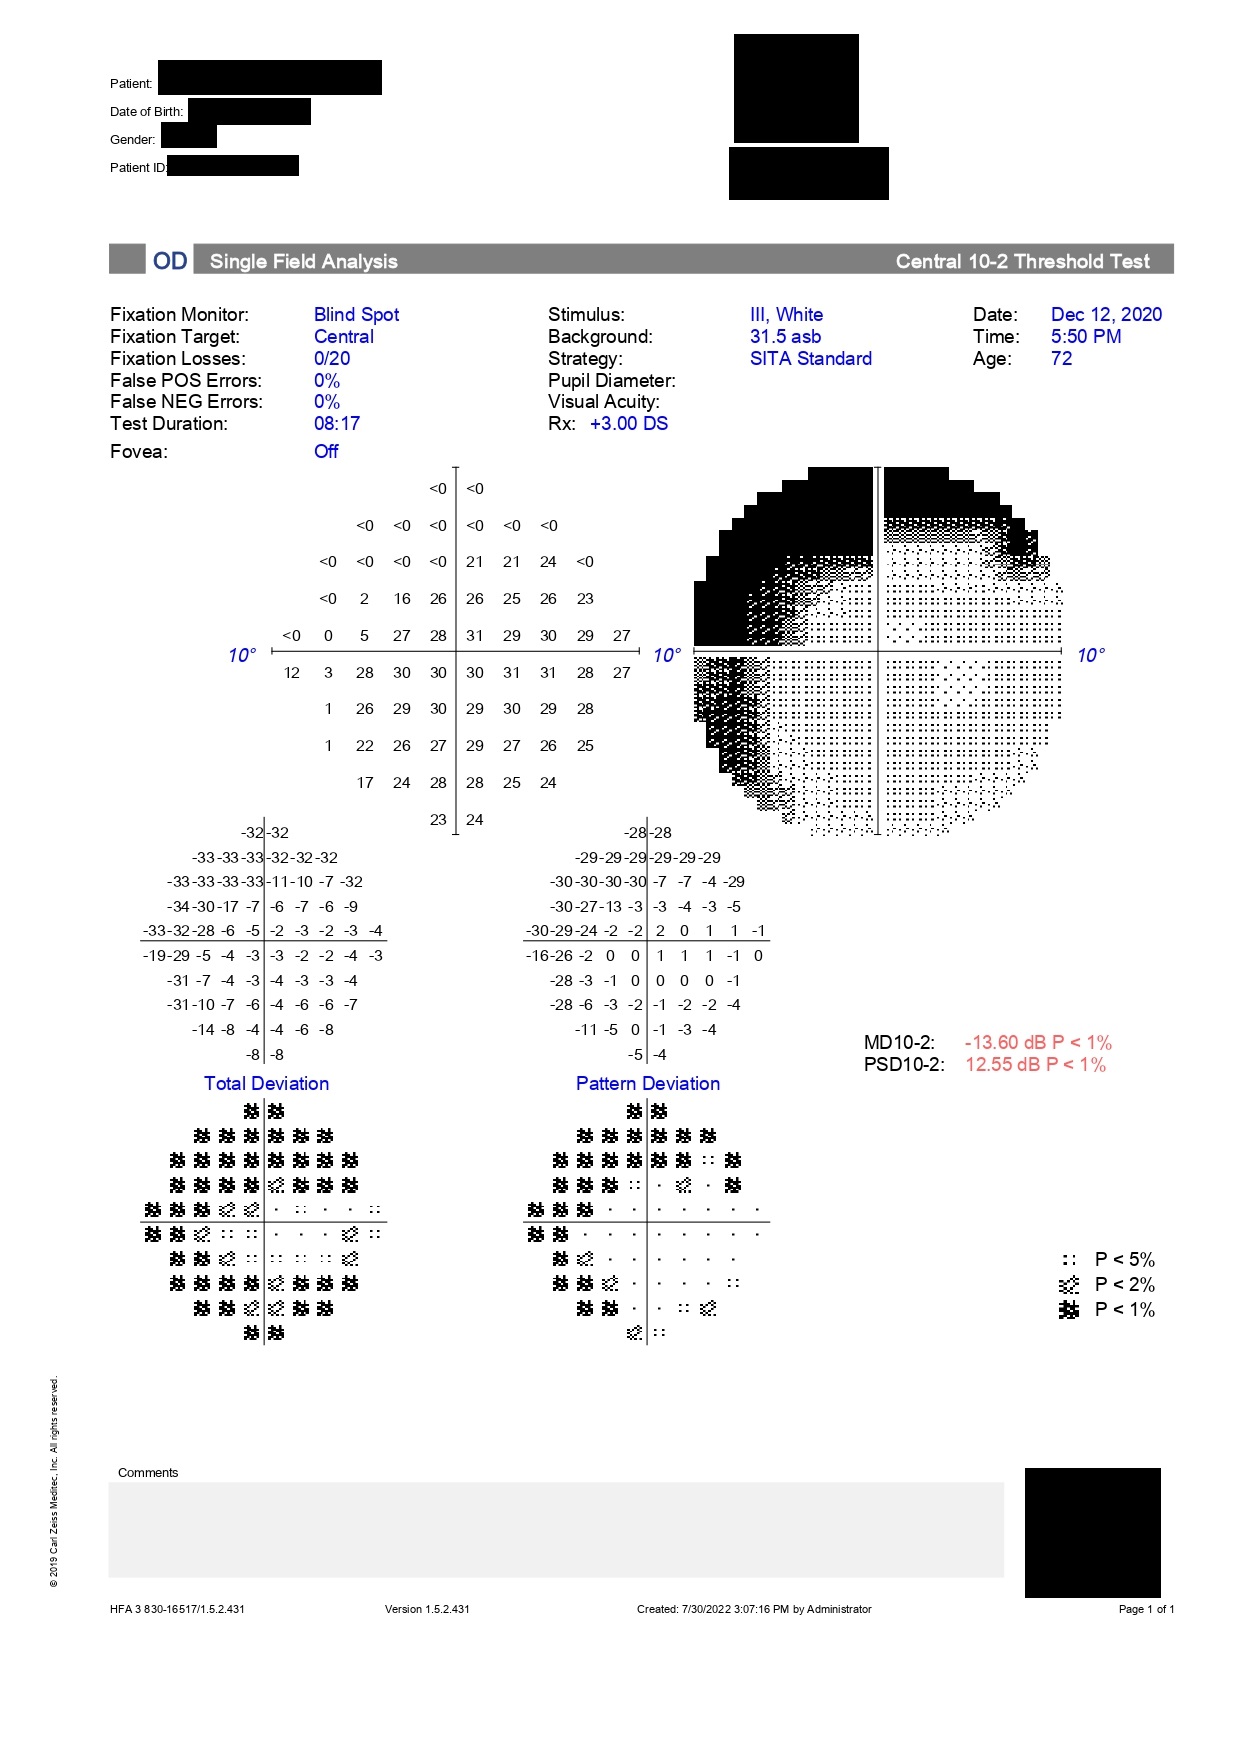
Because the distance between two points is 6 degrees, paracentral scotomas can be missed on 24-2 or 30-2 programs. Therefore, any defect close to the fixation on these programs should be retested with the 10-2 program.[14] The 10-2 provides a higher resolution and therefore highlights these defects.
A new program 24-2c has been recently introduced in the Humphrey Field Analyzer 3. Additional points have been added to the 24-2 program within the central 10 degrees to be able to detect the paracentral scotomas. However, the resolution of 10-2 is not achieved.[15]
The 10-2 tests the central 10 degrees of the retina. It consists of 68 closely placed points with a distance of 2 degrees between any two points. This means that a circle with a radius of 1 degree is the area of the retina that remains unevaluated between any four points. Glaucoma hemifield analysis is not done during this program, and the visual field index is also not calculated during this program.
Thus the number of points tested in various programs of the Humphrey visual field is
- 68 points in 10-2,
- 54 points in 24-2, and
- 76 points in 30-2.
The Macular program is the central 16 points of the 10-2 program. The points in the macular program are tested twice, and this is depicted as a second numeral in brackets below the points tested.
Indications
Visual field testing is practical in various clinical scenarios, including:
- Diagnosis and progression of glaucoma
- Assessment of neurological conditions concerning the visual pathway
- Documentation of field defect and assessment of progression in retinal diseases like retinitis pigmentosa and inflammatory conditions like birdshot chorioretinopathy
- For the visual disability certificate or driver's license
- The legal definition of blindness
- Evaluation of unexplained vision loss
Normal and Critical Findings
Interpretation of Automated Perimetry
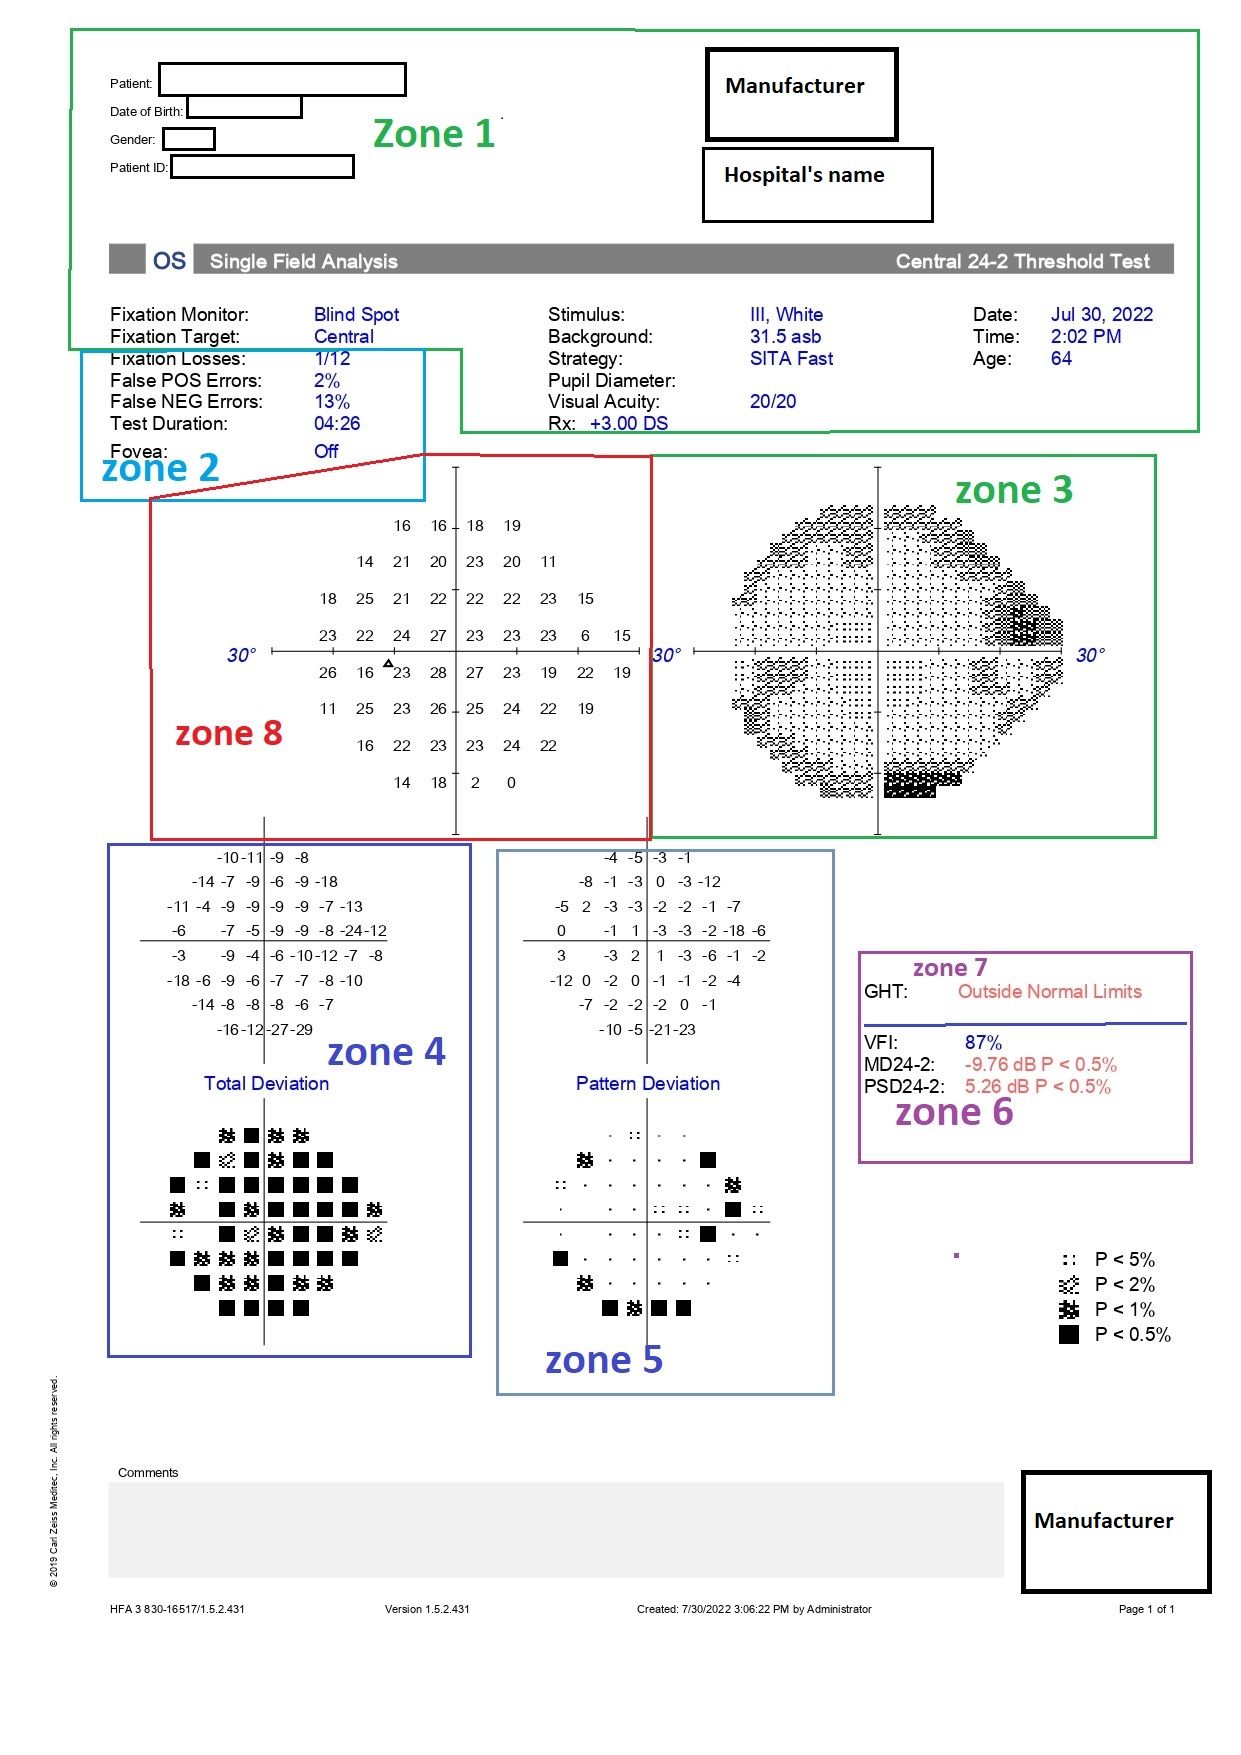
The automated perimetry report for Humphrey can be divided into eight zones for ease of understanding (Figure).
Zone 1: This section consists of the patient's information like the patient's name, date of birth, visual acuity, the refractive correction used for the patient for doing the test, and the patient's pupil size.[16][17]
The date of birth should be accurately entered; otherwise, the patient's data will be compared to the normative database of the wrong age group. The patient's pupil size should be at least 2.5 or 3 mm or the same as in the previous field test.[18][19][20] It also gives information about the test pattern performed (like 30-2 or 24-2), the strategy used (SITA standard or SITA FAST), and the fixation target used.
It is essential to use the recent most refractive correction of the patient with the appropriate near addition when performing the test.[21] If possible, the refraction can be checked the same day before performing the perimetry. It is better to use the built-in trial lens calculator to calculate the power of the trial lens to be placed in the trial lens frame for performing the test. This is because the power of the trial lens will not be the same as the actual spectacle correction of the patient.
Conditions requiring a complete near addition of 3.0 diopters include elderly individuals with an age of more than 60 years, pseudophakic or aphakic individuals, individuals with dilated pupils, and individuals with myopia of more than three diopters. Refractive error of even one diopter causes generalized depression in sensitivity which may become a cause for misdiagnosis.
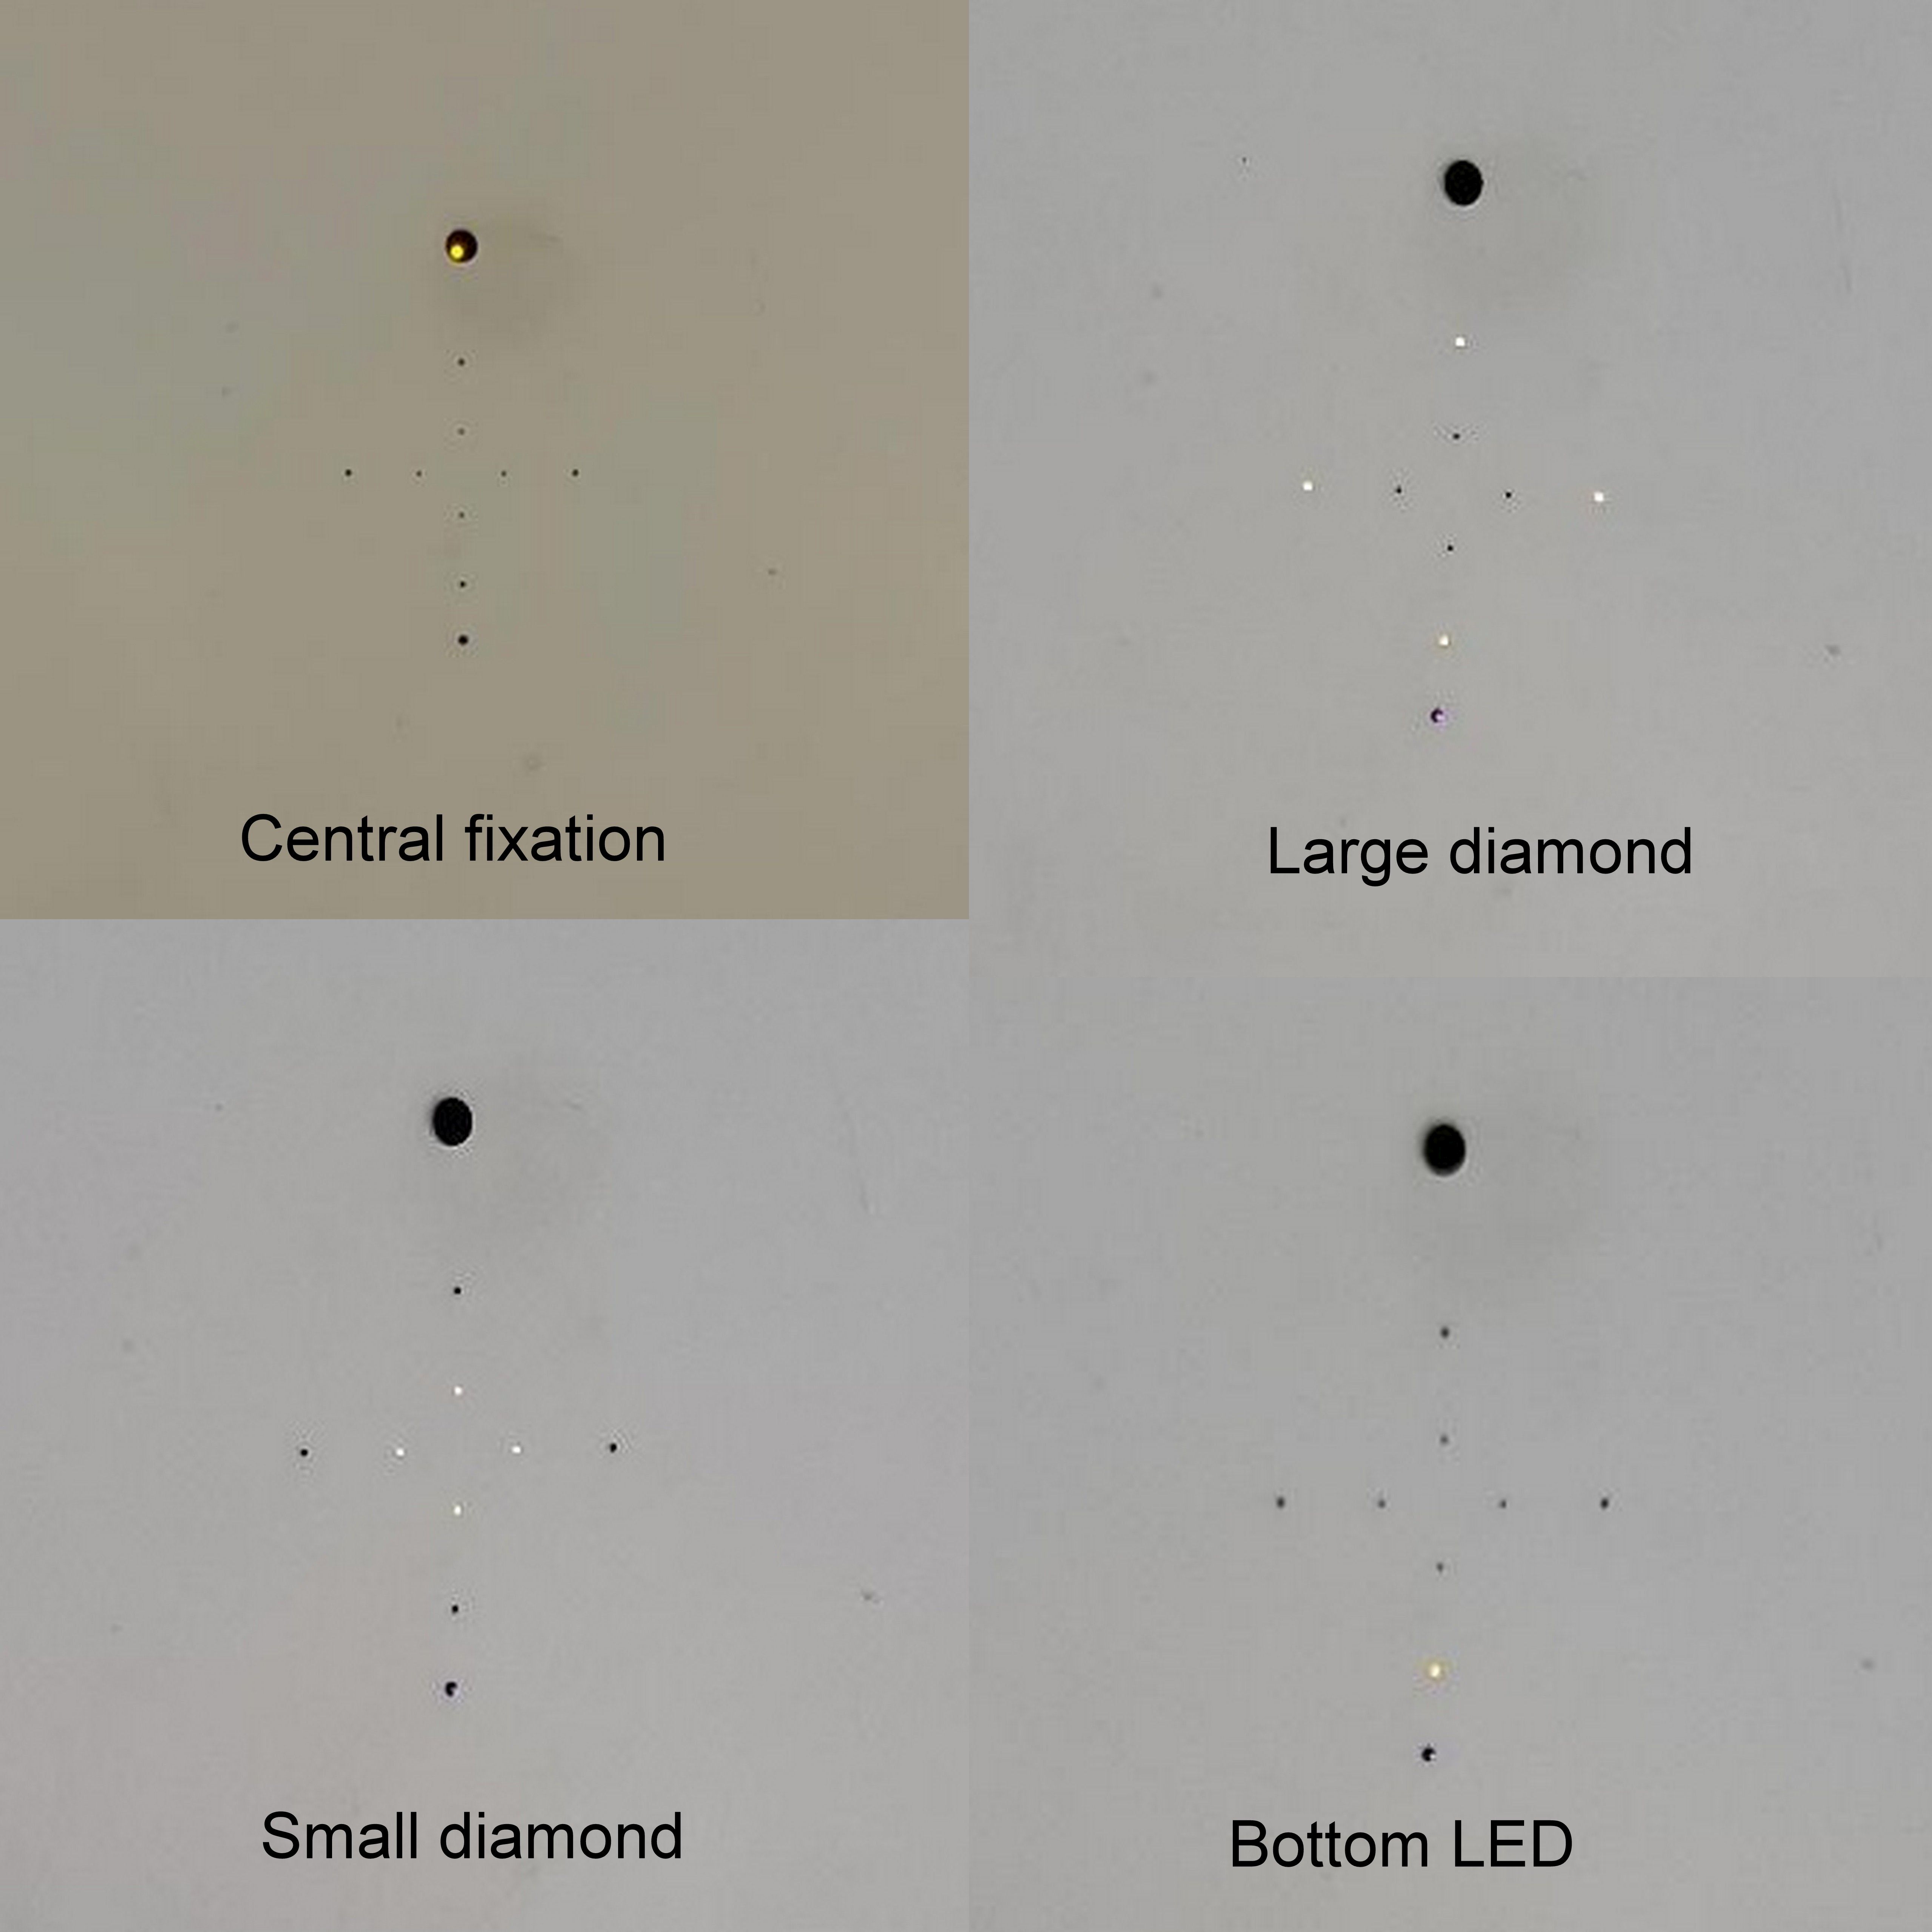
The fixation target may be a central dot which is the default target for Humphrey visual field Analyzer, or a large diamond that is present below the central dot (Figure). The larger diamond is used for patients with a large central scotoma. A small diamond fixation target within the large diamond is also used for evaluating the foveal threshold.
Zone 2: This zone mentions the foveal threshold and the reliability indices. The foveal threshold should correspond to the visual acuity of the patient. A good visual acuity with a less foveal threshold would indicate damage to the fovea, and a poor visual acuity with a good foveal threshold would indicate a refractive error that has not been corrected before performing the test.
Reliability indices like fixation losses, false positives, and false negatives are also mentioned in this zone.[22] Fixation losses are calculated using the Heijl-Krakau method. The patient is supposed to maintain fixation at the fixation target during the complete duration of the test, which means that the location of the blind test should remain constant throughout the test.
After localizing the blind spot once in the test, the machine randomly presents a stimulus to that point later on during the test. Response to this stimulus would mean that the patient has moved the fixation. This is measured as fixation loss. The machine checks this multiple times during a test. The presence of more than 20% fixation losses indicates poor reliability of the field report, per the manufacturer. However, before looking at the fixation losses, the location of the blind spot should be confirmed on the printout.
The other two methods of fixation monitoring are gaze tracking and video monitoring of fixation. The gaze tracker is printed at the bottom of the report. The upward deflection denotes eye movement, and the downward graph tracing indicates a blink. This tracks the eye movement throughout the test, and the examiner can instruct the patient to re-fixate upon noticing this tracing. The video eye monitor displays the eye of the patient on the monitor of the machine. It is also a good tool for an observant examiner. The examiner can instruct the patient to focus on noticing any screen movement.
False positives are recorded when the patient responds without a presented stimulus. False positives up to 33% are acceptable, as per the manufacturer. Excess false positives mask the underlying visual field defects.[23]
False negatives are recorded when the patient does not respond to a stimulus of higher intensity presented at the same location where previously the patient has responded to a lower intensity stimulus. False negatives of more than 33% suggest poor reliability of the fields, per the manufacturer.[23][24]
A study evaluating 10262 visual fields noted that fixations losses did not meaningfully affect the reliability (difference between predicted and observed mean deviation) of perimetry in patients with suspected or manifest glaucoma who have been taking multiple field tests. The study also noted that false positives had the maximum impact on the reliability of the visual field at any level of false positives. Special precautions should be taken if false positives occur in advanced disease or are noted in more than 20% of catch trials.[25]
False negatives affect the reliability less than false positives. A value of more than 35% in advanced disease and more than 25% in early disease may affect the reliability significantly. Increased time duration of the test (more than 2 or 3 minutes) may also affect the reliability.[25]
Zone 3: The greyscale graph is a color-coded representation of the retinal sensitivity of the patient. It is not used for the final interpretation of the field test but is important for patient education. The values closer to 0 dB are illustrated as black points of varying shades, whereas points close to 50 dB are illustrated as white points. The points with sensitivity greater than 40 dB are seen as white scotomas on the greyscale and require careful interpretation. They usually indicate a "trigger happy" patient who has responded without seeing the stimulus (false positive).
The greyscale is useful when comparing the fields of a patient on follow-up. It indicates the progression of the visual field both in extent and in-depth over time at a glance, given the reliability indices are within normal limits.
Zone 4: This zone comprises the total deviation numerical plot and total deviation probability plot.[26] The total deviation numerical plot indicates the depth of the field defect. It compares the dB value of the patient at all the retinal points tested to the normative data stored in the machine for that particular age. The normative database is calculated by collecting responses from a group of healthy subjects. The upper 95% of these values are arbitrarily taken as normal, and the lower 5% are considered abnormal.
This comparison gives the amount of deviation of the retinal sensitivity from normal at each point tested. Zero on the total deviation numerical plot indicates no deviation from normal; a negative value indicates a decrease in retinal sensitivity, with higher negative values indicating worse retinal sensitivity. A numerical with no sign on the total deviation numerical plot indicates better retinal sensitivity.
This data is also used to calculate the mean deviation index and the pattern standard deviation index.
Since the lower 5% of the data collected from the normal population is considered abnormal, all the abnormal data on the printout does not imply a disease state. The numerical in the total deviation numerical plot are statistically analyzed and represented as a total deviation probability plot. The probability plot is color-coded with lighter to darker shades representing p values from less than 5% to p values lesser than 0.5%. The probability plot demonstrates the extent or the pattern of the field defect.
Zone 5: This zone comprises the pattern deviation numerical plot and the pattern deviation probability plot.[26][27] These demonstrate the presence of localized field defects and their pattern. To calculate the numerical values of the pattern deviation numerical plot, the values on the total numerical plot are chronologically arranged, and the 7th best point on this data is noted.
An amount in the range of this value is deducted from all the values on the total deviation numerical plot. This gives the pattern deviation plot corrected for generalized depression in retinal sensitivity to highlight an underlying localized depression in the field.
A generalized decrease in retinal sensitivity would mean a uniform decrease in the height of the hill of vision compared to the normative database. A localized defect or decrease in retinal sensitivity would mean an irregularity or localized depression in the hill of vision with a normal height of the remaining hill of vision. A combined localized with a generalized decrease in retinal sensitivity indicates a decrease in the height of the hill of vision along with a localized depression.
Zone 6: This zone consists of the global indices, which are the mean deviation, pattern standard deviation, the visual field index, and p-value.[28]
Mean Deviation: It is the average of all the values of the total deviation numerical plot. It usually has a negative value.
Generalized field defects or advanced glaucoma will have a higher absolute mean deviation index. Localized field defects are, however, masked and have a low mean deviation index. A positive mean deviation index should be evaluated with caution as that would mean a higher than normal retinal sensitivity. The false positives should be assessed in these cases.[28]
Pattern Standard Deviation (PSD): This indicates a deviation in the shape of the hill of vision. It has a positive sign. A low value indicates a normal shape of the hill of vision, whereas a higher value indicates an irregular hill of vision. It is a useful index to diagnose cases with early glaucoma. In patients with advanced field defects, the shape of the hill of vision has deviated overall, so the PSD value is low; hence, this indicator loses its value in patients with advanced field defects.[28] This index is known as the loss variance in the Octopus machine.
Short-term fluctuation (SF): This is a feature of a field test using the full threshold strategy. Selective ten retinal points are checked for threshold twice, and the variability in the threshold value is indicated as SF. A value of more than 3 indicates low reliability.[28][29]
Corrected Pattern Standard Deviation (CPSD): This is the PSD value achieved after correcting for SF.
p-value: All the indices have a p-value that indicates the probability of that particular finding in a normal population. A p-value of less than 5% indicates a 5% or lesser chance for the index to be of that specific value in a normal population. No p-value in front of the index would mean a normal value of that global index.
Visual field index: This index is calculated from the pattern deviation numerical plot. It was designed to indicate the amount of ganglion cell loss. It gives more weightage to the retinal points in the central field. It indicates the percentage of retinal sensitivity of the patient compared to the normal retinal sensitivity for that age. A decrease in this index on follow-up perimetry scans indicates the progression of the field defect. Because it is derived from the pattern deviation graph values, cataract and refractive errors do not affect this index.[30]
Zone 7: This consists of the glaucoma hemifield test (GHT). Glaucoma affects the retinal ganglion cells on either side of the horizontal meridian.[31][32] Therefore, five areas, with a set of retinal points in each area, are tested on both sides of the horizontal meridian and compared. The results are displayed as GHT within normal limits, GHT borderline, or GHT outside normal limits.[33]
Zone 8: It is the raw data collected by the machine and consists of the retinal sensitivity (dB values) of each point tested for that program. Absolute scotoma is indicated by a zero dB value.
After assessing the visual field printout, Anderson criteria help to diagnose and identify the field defects due to glaucoma.
Anderson and Patella Criteria[6]
The following findings should be looked for in the visual field printout:
- Abnormal GHT
- Three or more contiguous non-edge points of the 30-2 field, or three or more contiguous points of the 24-2 field with a p-value of less than 5%, out of which at least one point has a p-value of less than 1%.
- The corrected pattern standard deviation should be abnormal with a p-value of less than 5%.
All these findings should be reproducible in two successive 30-2 full threshold fields to classify a particular field defect to glaucoma.
For the SITA strategy, modified Anderson criteria are applied where CPSD is replaced with PSD.
Interfering Factors
Stimulus Type: A white stimulus can be displayed on a white background. This is the most commonly used stimulus type (standard achromatic perimetry or SAP).[34] A colored stimulus can be alternatively displayed on a white background.[35] A blue stimulus can be displayed on a yellow background (short-wavelength automated perimetry or SWAP) or white background.[34][36]
SWAP test stimulus is said to target a subset of retinal ganglion cells that are affected earlier in glaucoma, though this is debatable.[37] The role of SWAP in clinical settings needs further evaluation.[38]
Stimulus size: There are five different sizes of stimulus that can be used. The smallest stimulus size (0.0625 square mm or 1/16 square mm) subtends an arc of 6 min, whereas the largest size (64 square mm) subtends an arc of 1.7 degrees. The most commonly used size is type 3 or 4 mm, which subtends an angle of 0.43 degrees on the retina.[39]
| Target |
Size ( in square mm) |
Degrees |
| 0 |
1/16 |
6 min of arc |
| I |
1/4 |
0.1 degrees |
| II |
1 |
0.2 degrees |
| III |
4 |
0.43 degrees |
| IV |
16 |
0.8 degrees |
| V |
64 |
1.7 degrees |
Stimulus duration: The duration of stimulus conventionally used in the Humphrey field analyzer is 0.2 seconds.
Background illumination: The uniform background illumination is 31.4 apostilb. At this luminance, the eye is minimally stimulated, and the visibility of the stimulus depends on the change in the contrast than brightness.[40]
To Ensure a Good Visual Field Result[41]
- The examiner conducting the test has a significant role to play. The patient should receive a careful explanation regarding what must be done during the test.
- The examiner must carefully monitor the patient's gaze throughout the test.
- It is better if the examiner has himself taken the perimetry test as they can share their experience and help the patient in better understanding of the test.
- The patient should be comfortably seated during the exam.
- It is always better if the patient understands what the stimulus will look like and how they need to respond.
- The results will be reliable if the patient is calm when taking the test and knows that it can be paused whenever they want.[42]
- The fields should never be interpreted in isolation. A structure-function correlation is always advised. The field defect on the printout should correlate with the changes in the optic nerve or retina.
Clinical Significance
Automated perimetry is an indispensable tool for assessing the visual field. The analysis of visual field defects helps in the localization of the disorders along the visual pathway. It is also of use in diagnosing and following individuals with glaucoma and other optic nerve and retinal disorders. Optic nerve pathologies like ischemic optic neuropathies, optic neuritis, and papilledema show characteristic field defects on visual field evaluation. Visual field examination is also useful in the assessment of legal blindness.
Results of Humphrey Field Analyzer in Various Clinical Scenarios
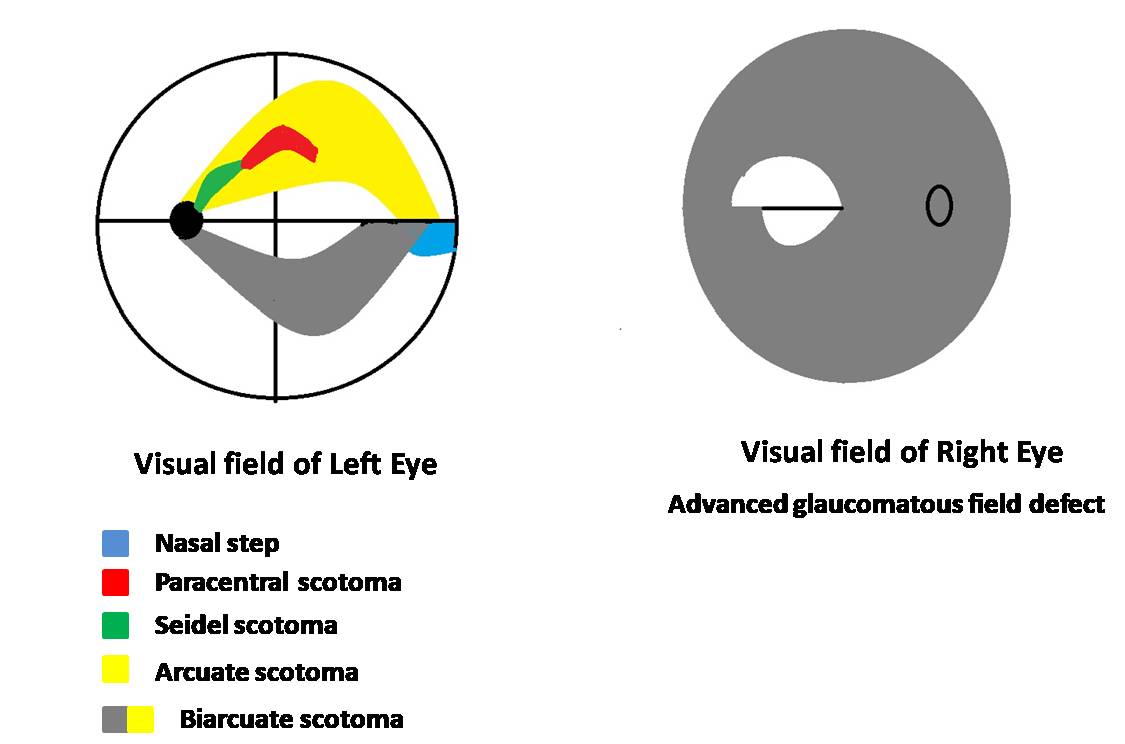
Field defects indicative of glaucoma (early-onset glaucoma to advanced disease ) include:
- A nasal step respecting the horizontal meridian
- Paracentral scotoma or cluster of low sensitivity points 10 to 20 degrees from the blind spot
- A seidel's scotoma, where the paracentral scotoma reaches the blind spot
- This seidel's scotoma then extends in an arcuate shape to reach the horizontal meridian (arcuate defect)
- With the progression of the disease, a ring defect is formed when two arcuate scotomas are seen in the superior and inferior hemifields[43]
- Advanced glaucomatous defects show a severe generalized defect with the sparing of a temporal island.[44][43][45]
Other than glaucoma, perimetry can detect pathologies affecting the optic nerve pathway (Figure) and neuropathies.[46][47]
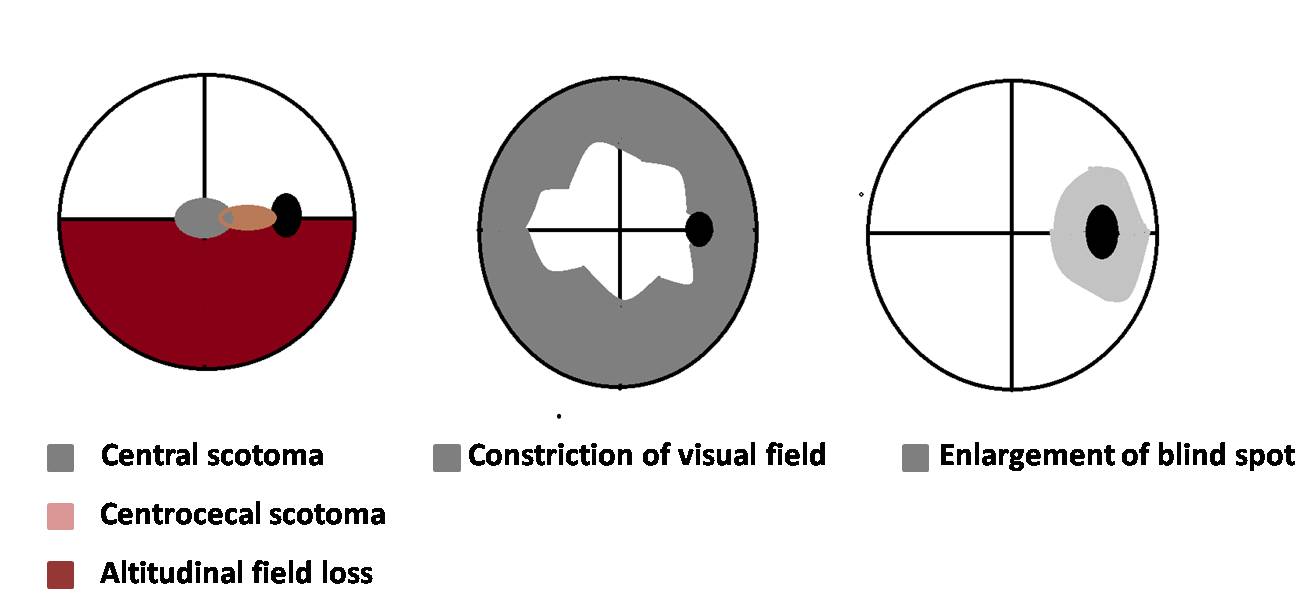
Idiopathic intracranial hypertension: The field defects commonly found in these patients are enlargement of the blind spot, generalized constriction of the visual field, loss of inferonasal visual field, or nasal step.[48]
Papilledema: Enlargement of the blind spot is the most commonly seen visual field defect, with constriction of the visual field seen in late cases where optic atrophy has started.[45][49]
Optic neuritis: The common field defect patterns documented in the optic neuritis treatment trial (ONTT) were diffuse field loss, altitudinal field defect, central scotoma or centrocecal scotoma, arcuate or double arcuate defects, and hemianopic defects. Patients with hemianopia field defects were more likely to show demyelinating lesions on magnetic resonance imaging of the brain.[50][51]
Ischemic optic neuropathy: Superior or inferior hemifield or altitudinal defects are the most common. Other field defect patterns include central scotoma, diffuse-field loss, or quadrantic field defects.[45][52][53]
Toxic optic neuropathy: Central scotomas are the commonly found field defect in cases of ethambutol optic neuropathy.[54] Toxic optic neuropathy has also been reported with vigabatrin, an anti-epileptic medication. Around 30% of patients taking vigabatrin show bilateral concentric peripheral visual field loss, and severe cases may have tunnel vision and visual loss that might progress even after stopping the drug.[55]
The visual loss due to vigabatrin is usually irreversible.[56] Other drugs/substances causing toxic optic neuropathy include tobacco, methanol, isoniazid, ethylene glycol, vincristine, cisplatin, methotrexate, carboplatin, amiodarone, cimetidine, digitalis, toluene, cyclosporine, sulfonamides, ciprofloxacin, chloramphenicol, linezolid, quinine, chloroquine, lithium, heavy metals (lead, mercury), lithium, and carbon monoxide.[57][54]
Disorders involving chiasma: Bitemporal hemianopia (Figure) and junctional scotomas are the common field defects that indicate lesions affecting the optic chiasma. Perimetry helps in the follow-up of the patients after surgery for pituitary gland tumors.[58]
Disorders involving the lateral geniculate nucleus: Lateral geniculate nucleus is situated in the posterior aspect of the thalamus. It receives dual blood supply from the anterior choroidal artery (AChA, a branch of the internal carotid artery) and the lateral posterior choroidal artery (LPChA, a branch of the posterior cerebral artery).[59][60]
Depending on the artery involved, the field defect may be a wedge-shaped congruent homonymous sectoranopia (LPChA lesion) or a quadruple sectoranopia, or loss of upper and lower homonymous quadrants (AChA lesion) (Figure).
Disorders involving the optic tract: Homonymous hemianopia (usually incongruous) is the typical field defect in these cases. Perimetry is useful in localizing the lesions along the visual pathway. Follow-up perimetry has been found to show improvement in 50 to 60% of these cases.[46][61][62]
Optic disc drusen: Disc drusens do not cause visual symptoms; however, field defects are common. Field defects are more common in individuals with superficially located or visible disc drusens. The field defects vary from inferonasal visual field defects, arcuate field defects, nasal steps, and enlargement of blind spots to constriction of visual fields.[63]
Tilted optic disc: A congenital anomaly where the optic nerve makes an angled entry into the eye. This results in inferior tilt, more commonly inferonasal ectasia or crescent, which causes a myopic refractive error. Perimetry of these individuals shows a superotemporal field defect similar to the defect found in chiasmal disorders. However, unlike chiasmal disorders, field defects due to the tilted disc crossing the vertical midline as these defects are caused by the refractive error induced by the tilt.[64][65]
Toxoplasma retinochoroiditis: Lesions within one disc diameter of the optic nerve head are known to involve all the layers of the retina. Visual field testing of such lesions after healing has shown absolute scotomas with breakout to the periphery, probably because of the involvement of photoreceptors and the nerve fiber layers. Visual field testing in these cases will help in testing the treatment efficiency of such cases.[66]
Malingering: Individuals who feign visual loss for personal gain may present with complaints of tunnel vision or constriction of the visual field. This can be differentiated from constriction of the visual field due to organic causes by testing their field by kinetic Goldmann perimetry. The degree of peripheral constriction of the visual field will remain the same even after increasing the distance between the individual and the tangent screen in the case of malingerers.
Unlike individuals with an organic cause for the peripheral constriction will have a lesser extent of peripheral constriction when their distance from the tangent screen is increased. Another way of differentiating functional visual loss from organic causes is that the constriction of the visual field will be the same for stimuli of different sizes or contrast.[67]
Individuals may also claim to have monocular hemianopias. These can be differentiated from organic causes by performing binocular visual field testing on the Goldmann perimeter. The monocular hemianopia is compensated by the overlapping visual field of the normal eye in the case of individuals with organic causes.[68]
Branch retinal vein occlusion: The field loss is segmental with involvement of the retina from the macula up to the periphery corresponding to the area drained by the occluded vein. Kinetic perimetry can better document the peripheral field loss as automated perimetry documents the field loss up to 30 degrees.[69] However, test strategies for evaluating larger areas of the visual field are also available in the Humphrey field analyzer, which includes the full threshold strategy for the 60-4 program.
Central retinal vein occlusion: Both central and peripheral scotoma is more common in patients with ischemic central retinal vein occlusion than in non-ischemic central retinal vein occlusion. The more common peripheral field defect seen with ischemic central retinal vein occlusion is an inferonasal defect.[70]
Branch retinal artery occlusion: The field defect varies with the duration of onset of the disease. Patients presenting within one week of onset may have central scotoma or central altitudinal defects corresponding to the area of affection. Peripheral field defects commonly found are inferior nasal or superior nasal field defects.[71]
Retinitis pigmentosa: The field defect characteristic of this disease is gradually progressive peripheral field loss. The superior visual field is often involved first due to the early involvement of the inferior retina.[72] The central visual field is affected in patients with cystoid macular edema, epiretinal membrane, or retinal pigment epithelium changes at the macula.[73][74]
Birdshot chorioretinopathy: Constriction of the peripheral visual field, enlargement of blind spot, central or paracentral scotoma, or generalized diminished sensitivity are some of the common visual field defects associated with birdshot chorioretinopathy.[75][76]
Migraine: Patients with migraine may present with visual field defects. The prevalence of field defects is known to increase with the individual's age and the disease's duration.[77] The types of field defects associated with migraine include generalized depression of sensitivity, arcuate defects, nasal step, and isolated scotomas.[77][78]
Riddoch Phenomena: This is also known as statokinetic dissociation.[79] In this phenomenon, an individual can perceive moving objects in the affected visual field. However, the individual fails to perceive static objects or stimuli in the affected visual field. In other words, the static perimetry of such an individual will show homonymous hemianopia or quadrantanopia, whereas the kinetic perimetry will be within normal limits. This is usually present in conditions where the primary visual cortex located in the occipital lobe is affected.[79]