Definition/Introduction
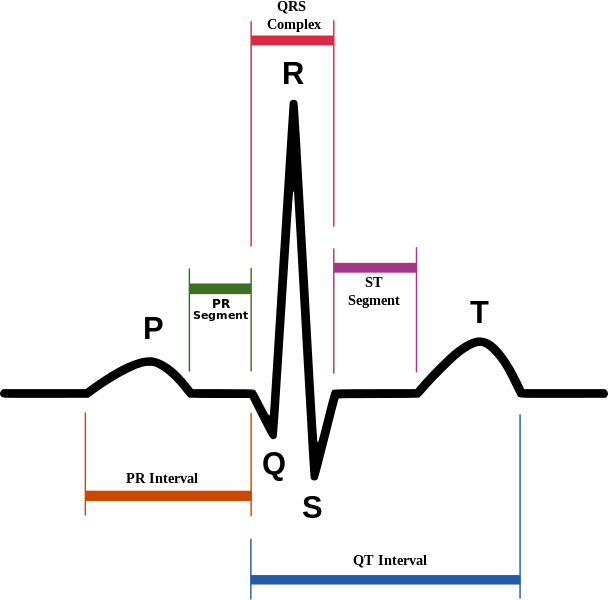
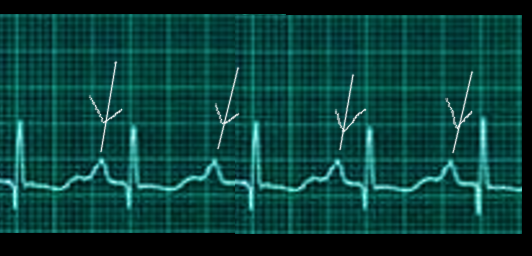
The P wave and PR segment is an integral part of an electrocardiogram (ECG). It represents the electrical depolarization of the atria of the heart. It is typically a small positive deflection from the isoelectric baseline that occurs just before the QRS complex. It can sometimes have abnormalities in morphology or timing that can be indicative of significant clinical pathology.[1] An understanding of the normal and abnormal P wave morphology is, therefore, a crucial part of ECG interpretation. This article will review the basics of P wave interpretation, including characteristics of both the normal P wave and its pathologic abnormalities.
Issues of Concern
Location
The first deflection of the P wave normally appears between 120 and 200 milliseconds (ms) before the first upward deflection of the QRS complex. It is the first deflection from baseline voltage observed on an ECG. This length between the P wave and QRS complex is represented by the PR interval, which is the time between the onset of atrial depolarization and the onset of ventricular depolarization.
Physiology
The P wave represents the electrical depolarization of the atria. In a healthy person, this originates at the sinoatrial node (SA node) and disperses into both left and right atria. Depolarization of the right atrium is responsible for the early part of the P wave, and depolarization of the left atrium is responsible for the middle and terminal portions of the P wave.
PR segment Interval and Timing
The PR interval represents the time between atrial depolarization and ventricular depolarization. Abnormalities in the timing of the PR segment can indicate pathology.
A PR interval of under 120 milliseconds (ms) may indicate that electrical impulses are traveling between the atria and ventricles too quickly. A classic example of this is the Wolff-Parkinson-White (WPW) syndrome, in which electrical signals bypass the atrioventricular (AV) node through an accessory tract known as the bundle of Kent.[2] As the accessory tract allows more rapid signal transmission than the AV node, a shorted PR interval often presents on ECG along with the characteristic delta wave. A delta wave is a sharp upward positive slope that is visible from the baseline voltage of the PR interval into the QRS complex. Low atrial or junctional rhythm is another cause for a short PR interval where the distance of the atrial signal to travel to the AV node becomes shortened and hence leading to a shorter PR interval.
Likewise, a prolonged PR interval is also essential to identify. An ECG displaying sinus rhythm with a consistent PR interval greater than 200 ms and 1 to 1 relationship of P to QRS complexes without any dropped QRS complex is considered a first-degree atrioventricular (AV) block. A first degree AV block is indicative of a delay in the electrical signal as it travels through the AV node on its way from the atria to the ventricles. The first-degree AV block is relatively common and has largely been considered a benign and clinically unimportant finding and may not require further workup or interventions.[3]
Another abnormality in the PR interval is a second-degree AV block. There are two types of second-degree AV blocks: If there is a prolonged PR segment with increased lengthening of the PR segment with each consecutive beat occasionally followed by no QRS complex, it is known as a second degree Mobitz type I block, also known as Wenckebach block. In the other type of second-degree block known as Mobitz type II block, the PR segment can be normal or prolonged but remains constant with every beat, and occasionally, a sudden unexpected drop of the QRS complex is present. In Mobitz type II, there is significant conduction disease in this His-Purkinje system that is irreversible and requires pacemaker placement compared to Mobitz type I blocks.[4]
Third-degree AV block demonstrates complete AV dissociation where the P waves are marching through fewer QRS complexes that may be wider.
Morphology [5]
Left atrial abnormalities such as hypertrophy and/or dilation are sometimes identifiable on ECG by P wave morphology. Lead V1 can provide useful information about the status of the left atrium. The P wave is often biphasic in this lead. The first part of the P wave is from the right atrium, and the latter part is from the left atrium. Anterior forces in the right atrium give an initial positive deflection, and posterior forces in the left atrium give a later negative deflection. A large negative deflection can indicate a left atrial abnormality. Specifically, this deflection qualifies as large if its area encompasses over one small square on the ECG grid (greater than 0.04 seconds).
Prolongation of the P wave to a duration exceeding 120 ms classically associates with left atrial abnormality and is referred to as P mitrale. These P waves often have a pronounced notch with a peak-to-peak distance of over 0.04 seconds (one small box on the ECG grid). Left atrial abnormalities can appear in systemic hypertension, mitral valve disease, aortic stenosis, and as a secondary finding in left ventricular hypertrophy.
Right atrial abnormalities are also identifiable on ECG. Specifically, a P wave amplitude in the inferior leads exceeding 2.5 mm is indicative of right atrial enlargement and is referred to as P pulmonale. It correlates with chronic obstructive lung disease, pulmonary hypertension, and some congenital heart diseases and often presents in conjunction with right ventricular hypertrophy. It can also be seen transiently in right heart strain secondary to acute pulmonary embolism.
Clinical Significance
The adequate interpretation of ECGs requires the ability to recognize both normal P waves and PR segments as well as common abnormalities that could indicate disease. This article explains different morphologies in the P wave and timing of the PR segment leading to pathology. Proper interpretation of ECGs is essential to all nurses, clinicians, and other members of the healthcare team in effectively recognizing pathology and heart blocks and can lead to better patient management and treatment.
Nursing, Allied Health, and Interprofessional Team Interventions
ECG interpretation and identification of pathology on electrocardiograms should be an integral part of monitoring any patient placed on telemetry or who presents with signs and symptoms of abnormal cardiac function. The healthcare team, including physicians, nurses, and technicians, should be able to quickly recognize common abnormal ECG patterns and intervene or notify a healthcare member, such as a cardiologist, that can treat the pathology found on the electrocardiogram rhythm.
Early identification by nursing staff to alert clinicians of an abnormal rhythm or electrical conduction defect on ECG can lead to rapid management and decreased morbidity and mortality of patients. It is in the patients' best interest for all healthcare team members to have the ability and confidence to point out P wave abnormalities and PR segment prolongations or heart blocks.
Nursing, Allied Health, and Interprofessional Team Monitoring
Healthcare team members, including nurses, should actively monitor patients placed on telemetry or patients with routine ECGs for common arrhythmias and abnormal conduction defects. They can then notify clinicians and other team members of the abnormality and decrease morbidity and mortality in patients.