Continuing Education Activity
Interpreting the electrocardiogram (ECG) is a key step in determining the heart's electrical axis. The cardiac axis is the sum of all depolarization vectors of the heart, and vector analysis determines the direction of the net flow of current through the heart. Adequate knowledge and appropriate application of vector analysis are important for all clinicians because defining the electrical axis can provide insight into underlying disease states and help steer the differential diagnosis towards or away from certain diagnoses.
This activity describes what makes up the electrical axis and the ventricular (QRS) axis classifications and reviews various approaches to determining the electrical axis and causes of axis deviation, empowering healthcare professionals with the necessary knowledge and tools to improve patient care when interpreting the ECG and employing vector analysis in various disease states. Additionally, the activity highlights the role of the healthcare team in correctly analyzing the ECG to provide optimal patient care.
Objectives:
Identify the key components of electrical axis deviation on an electrocardiogram.
Differentiate between right-axis deviation and left-axis deviation based on electrocardiogram patterns.
Apply knowledge of vector analysis to interpret electrocardiograms and determine the electrical axis.
Communicate findings and collaborate with other interprofessional team members in managing axis deviation cases.
Introduction
One of the key steps in interpreting an electrocardiogram (ECG) is determining the heart's electrical axis or the sum of all depolarization vectors of the heart. The cardiac vector suggests the direction of the net flow of current through the heart.[1] Determining the electrical axis can provide insight into underlying disease states and help steer the differential diagnosis towards or away from certain diagnoses. Axis determination is also important to correctly identify certain life-threatening arrhythmias that have implications for definitive management strategy.
A vector is illustrated using an arrow, with the arrowhead pointing towards the net direction of the current flow. The length of the arrow is proportional to the voltage. A normal cardiac vector typically runs from the base of the heart to the apex. Cardiac depolarization occurs from the endocardium to the epicardium; however, some current may also travel through the walls of the cardiac chambers to the epicardium. The sum of all vectors/potentials that run from the base to the apex at an instant is also called an instantaneous mean vector. Vector analysis is the basic concept of analyzing ECG. Adequate knowledge and application of vector analysis are important for all clinicians. Axis and vector are used interchangeably throughout this topic.
Function
In electrophysiology, a vector represents both the magnitude and direction of the action potential generated by an individual myocyte. The sum of all individual vectors generated by depolarization waves comprises the electrical axis. Because each myocyte can produce an action potential, an axis for each wave and interval of the cardiac cycle can be determined. Knowing the axis of each and how they interact can reflect certain pathology. When the electrical axis is discussed and taught, the ventricular axis is typically used in common clinical practice, although the atrial axis can be useful in clinical situations.[1]
The axis is described in degrees, with 0° indicating a horizontal direction towards the heart’s left side for a vector. For a vector below 0° in a clockwise direction, the axis turns positive, and if a vector is straight downwards, it is +90°. If the axis extends from the left to right side of the heart in a clockwise direction, it reaches +180°. If the vector extends straight upward, it is at -90°.[1]
Under normal circumstances, the left ventricle comprises most of the heart muscle and generates the most electrical force visible on the ECG. The mean QRS vector, representing the average direction of all cardiac vectors, typically positions at 59° in a normally situated heart. This vector points downward and slightly towards the left, indicating the apex is mostly positive compared to the heart’s base. The heart’s vertical axis is determined practically using 3 unipolar and 3 bipolar ECG leads, while the horizontal axis is calculated using chest leads. The distinction between the left and right axes is an extension of the vertical axis of the heart. Each lead has 2 electrodes connected from one end of the heart to the opposite side. The direction from the negative end to the positive end is called an axis of the lead. In a hexagonal system used for vertical axis determination, the following are the normal directions of the lead vectors:
- Lead I: Placed between right arm (-ve) and left arm (+ve) horizontally, 0°
- Lead II: Placed between right arm (-ve) and left leg (+ve), +60°
- Lead III: Placed between left arm (-ve) and left leg (+ve), +120°
- Lead aVR: Unipolar lead with a single positive electrode at right arm, +210°
- Lead aVL: Unipolar lead with a single positive electrode at left arm, -30°
- Lead aVF: Unipolar lead with a single positive electrode at left foot, +90°
Learning these polarities is important for a quick axis determination, particularly for leads I, II, and aVF. Examining the QRS complex, which indicates ventricular depolarization, allows for determining the ventricular axis. The ventricular (QRS) axis signifies the sum of all individual vectors generated by the depolarization waves of ventricular myocytes.[2]
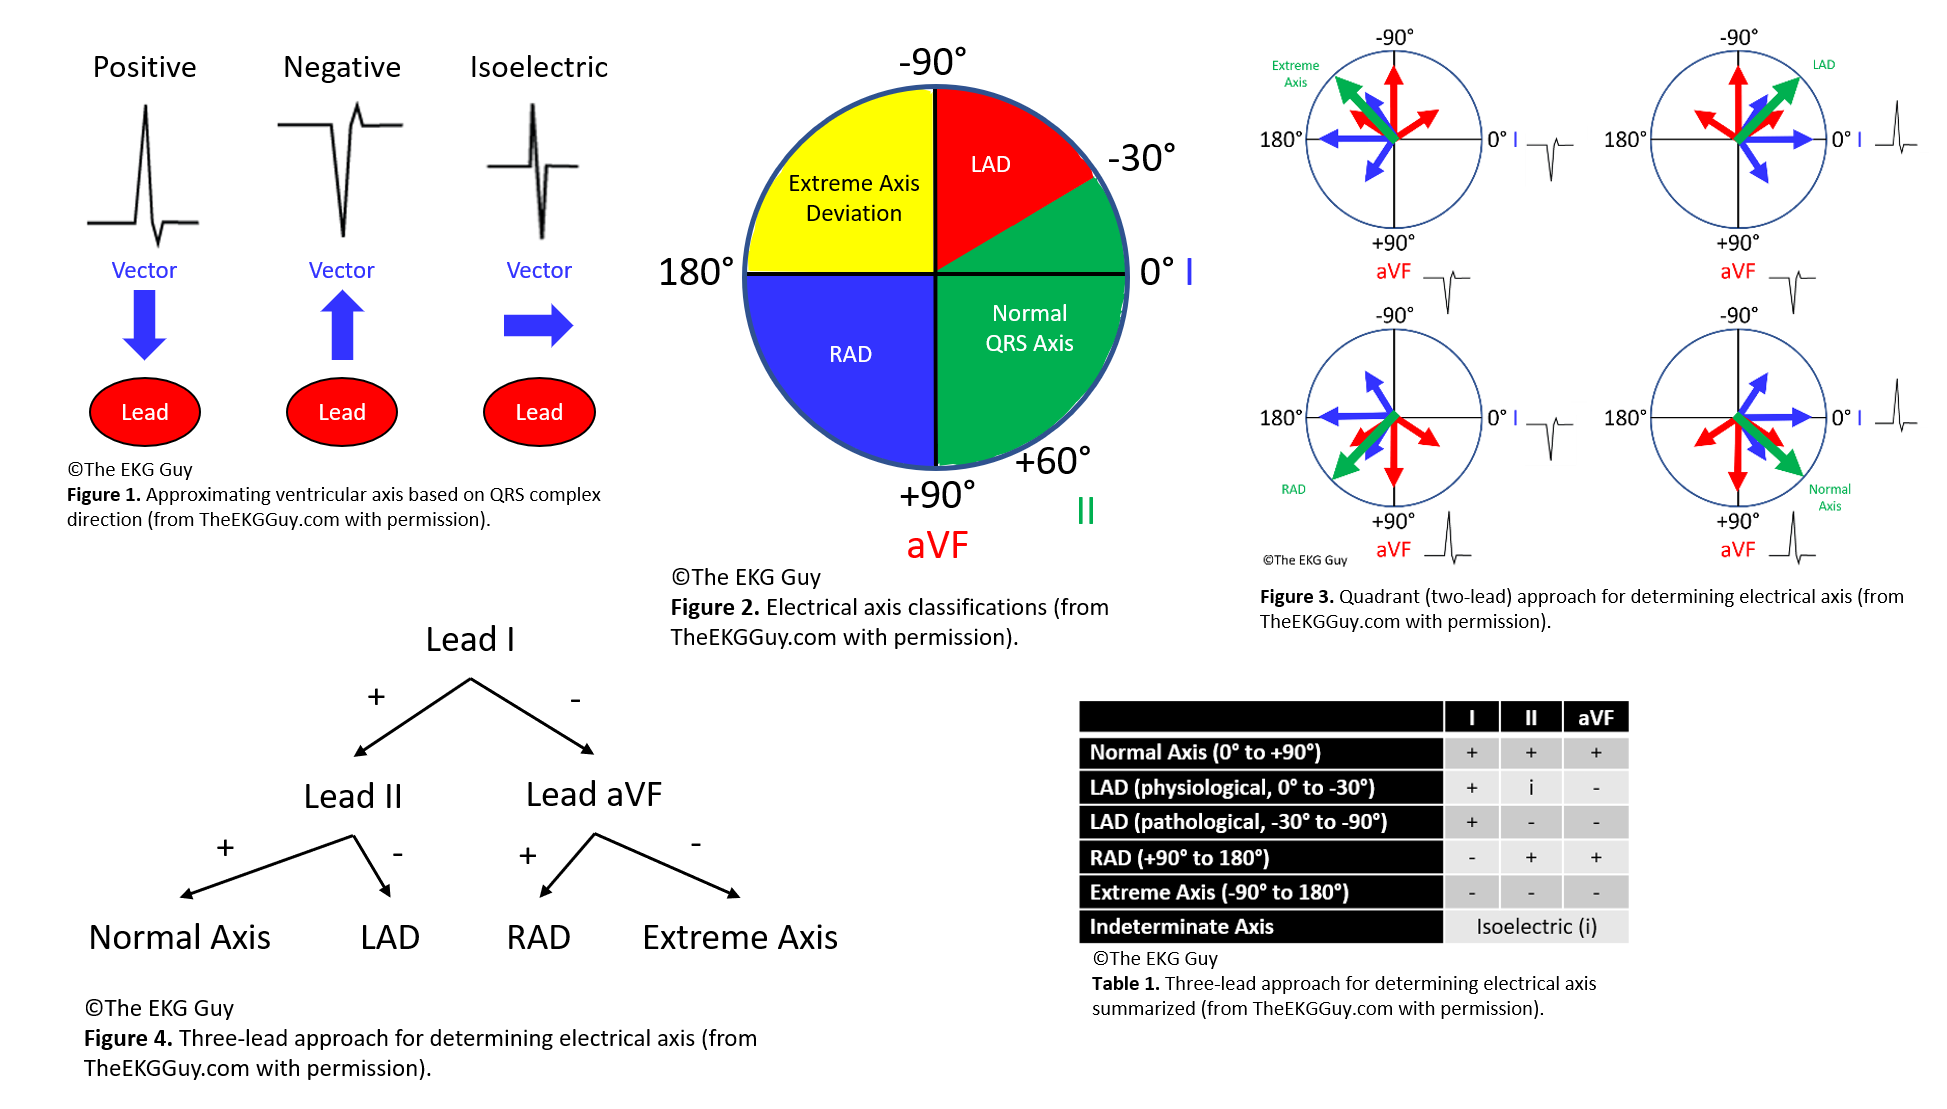
The ventricular (QRS) axis is determined indirectly by evaluating the vectors produced under the electrodes; this is performed by interpreting the electrical signal (QRS complex) recorded at each electrode as positive, negative, or isoelectric; then their relationship with each other is considered. Generally, a positive QRS complex in a lead has a ventricular axis approximately in the same direction going to that lead. Meanwhile, a negative QRS complex in a lead has a ventricular axis that is approximately in the opposite direction of that lead. If the QRS complex is isoelectric in a lead, the ventricular axis is perpendicular (90°) to that lead [3] (see Figure. Electrical Axis).
Issues of Concern
The normal adult QRS axis is between -30° and +90°, directed down and to the left.[4] This adult range is sometimes extended from -30° to +100°. The QRS axis moves leftward throughout childhood and continues into adulthood. At birth, the normal QRS axis lies between +30° and +190°. Between 8 and 16 years, the axis moves leftward, typically lying between 0° to +120°. There is disagreement on the exact degree that defines each type, but some of the mentioned general cut-off values can be used for describing the QRS axis.[5]
Electrical Axis Classification
There are 5 main electrical axis classifications.[6]
- The normal axis is between -30° and +90°. The QRS vector is directed downward and slightly to the left
- The left axis deviation (LAD) is between -30° and -90°. The QRS vector is directed upward and to the left
- Right axis deviation (RAD) is between +90° and 180° or beyond +100° if using the adult range; the QRS vector is directed downward and to the right
- Extreme axis deviation between -90° and 180°, and the QRS vector is directed upward and to the right
- Indeterminate axis: the QRS complex is isoelectric or equiphasic in all leads with no dominant QRS deflection
Approach to Determining Axis: Vertical Axis
There are multiple methods to determine the electrical axis. The following are simple and adequate approaches to assess the ventricular (QRS) axis. Hence, the focus will be on the QRS complexes in specific leads. The main QRS complexes to evaluate are those in leads I, II, and aVF. The positive ends of these 3 leads fall within the normal axis region. The positive ends of leads I, II, and aVF are 0°, +60°, and +90°, respectively. Therefore, the axis is normal if all 3 of these leads have positive QRS complexes.
Method 1, Leads I and aVF: A straightforward way to determine the electrical axis is to inspect limb leads I and aVF, referred to as the quadrant approach or 2-lead method. Each of the 4 quadrants represents 90° and an axis type (eg, 0° to +90° is a normal axis; +90° to 180° is RAD; 0° to -90° is LAD; and -90° degrees to 180 degrees is an extreme axis). Therefore, if leads I and aVF are positive, the axis falls within the normal range. If lead I is positive and lead aVF is negative, then there is LAD. If lead I is negative and lead aVF is positive, there is RAD; if both leads I and aVF are negative, the axis falls within the extreme axis range.
- This method approximates the true axis closely and narrows the normal axis range; however, this can result in an inaccurate interpretation of the true electrical axis. For instance, if this approach is used with a positive lead I and a negative lead aVF, the axis would be interpreted as LAD. If the true axis were -20°, which lies in the LAD quadrant using this method, this value would still be within the normal axis range. Nevertheless, this method is easy to learn and sufficient in most cases--and can be balanced by locating the most isoelectric limb lead and knowing that the true axis lies nearly perpendicular to it. (This can also help narrow the axis to within 10° of the normal axis.)
Method 2, Leads I, II, and aVF: A more accurate approach than the simple quadrant approach considers leads I, aVF, and lead II (the 3-lead method). If the net QRS deflection is positive in both leads I and II, the QRS axis is normal. If the net QRS deflection is positive in lead I but negative in lead II, then there is LAD. Notice lead aVF was not needed in both cases. In other words, if lead I is positive, look next to lead II. If lead I is negative, look next to lead aVF. If lead aVF is positive, the axis is rightward; however, if lead aVF is also negative, there is an extreme axis.
Method 3, Isoelectric Lead: Another simple way to estimate the ventricular (QRS) axis is to locate the most isoelectric limb lead along the frontal plane. The isoelectric (equiphasic) lead represents the lead with a net amplitude of 0 and the smallest overall amplitude. The QRS axis is approximately perpendicular (90°) from the positive pole of that lead.
- To determine which direction to move 90° from that positive pole, look at the net deflection in another lead. For example, suppose the isoelectric limb lead is lead II, with a positive end at +60°. In that case, the electrical axis is approximately 90° from +60° in either direction. Therefore, the axis can lie around +150° (RAD) or -30° (borderline LAD). If lead I, with a positive pole at 0°, has a net positive QRS deflection, then the axis will be closer to -30° (LAD); and, if lead I has a net negative QRS deflection, then the axis will be closer to +150° (RAD).
Approach to Determining Axis: Horizontal Axis
The methods above help determine the electrical axis in the frontal plane. The horizontal axis can be determined as follows. Determining the axis along this plane involves observing the heart beneath the diaphragm. The axis may exhibit clockwise or counterclockwise rotation, depending on when the transition from predominantly negative QRS complexes to mostly positive QRS complexes occurs in conjunction with the precordial leads (V1-V6). (Ideally, this would be the isoelectric precordial lead.) Typically, this transition occurs between leads V3 and V4. However, if transitioning happens earlier, it is deemed to have a counterclockwise rotation and an early transition, indicating left ventricular forces are anteriorly directed. On the other hand, if transitioning occurs later (in which there is poor R wave progression), this is considered a clockwise rotation and a late transition—indicating the left ventricular forces are posteriorly directed.
Clinical Significance
The following conditions are major causes of left and right axis deviation.
Causes of Left Axis Deviation
- Normal variation (physiologic, often age-related change)
- Left ventricular hypertrophy
- Conduction defects: left bundle branch block, left anterior fascicular block
- Inferior wall myocardial infarction
- Preexcitation syndromes (eg, Wolff-Parkinson-White syndrome)
- Ventricular ectopic rhythms (eg, ventricular tachycardia)
- Congenital heart disease (eg, primum atrial septal defect, endocardial cushion defect)
- Hyperkalemia
- Emphysema
- Mechanical shift, such as with expiration or raised diaphragm (eg, pregnancy, ascites, abdominal tumor, organomegaly)
- Pacemaker-generated rhythm or paced rhythm
Causes of Right Axis Deviation
- Normal variation (eg, children, young adults)
- Limb lead reversal (left and right arm electrodes)
- Right ventricular overload syndromes (acute or chronic)
- Right ventricular hypertrophy
- Conduction defects: left posterior fascicular block, right bundle branch block
- Lateral wall myocardial infarction
- Preexcitation syndromes (eg, Wolff-Parkinson-White syndrome)
- Ventricular ectopic rhythms (eg, ventricular tachycardia)
- Congenital heart disease (eg, secundum atrial septal defect)
- Dextrocardia
- Left pneumothorax
- Mechanical shift, such as with inspiration or emphysema
- Conditions that cause right ventricular strain (eg, pulmonary embolism, pulmonary stenosis, pulmonary hypertension, chronic lung disease, and resultant cor pulmonale)[7]
Other Issues
Ventricular Axis in Bundle Branch Blocks
Determining the ventricular (QRS) axis in a bundle branch block setting is controversial. With the right bundle branch block (RBBB), RAD or LAD may indicate a bifascicular block. Understanding that the terminal portion of the QRS complex indicates the delay in right ventricular activation with RBBB, one method to estimate the frontal plane axis involves examining the initial 80 to 100 milliseconds of QRS deflection, primarily reflecting left ventricular activation. Similarly, with left bundle branch block (LBBB) and other intraventricular conduction delays, the initial 80 to 100 milliseconds of the QRS deflection or the entire QRS complex can be used to determine the axis.[8][9][10]
Enhancing Healthcare Team Outcomes
Determining the electrical axis on an electrocardiogram can narrow the differential diagnoses and lead to an efficient diagnostic approach, helping to decrease the time needed to arrive at the correct diagnosis and improve patient outcomes. An interprofessional team of clinicians, nurses, and technicians trained in interpreting an ECG is necessary to achieve this goal. An emergency department nurse trained in the potential implications of axis deviation can help clinicians provide prompt and prudent diagnostic and therapeutic care for the patient. A cardiac specialty-trained nurse can assist clinicians in monitoring patients with acute cardiac pathology to help treat potential complications. A nurse well-versed in interpreting an ECG, especially in determining the electrical axis and its significance, should communicate the findings to the clinicians. In doing so, a collaborative interprofessional team of healthcare providers can improve patient care and outcomes.