Introduction
Blood gas analysis is a commonly used diagnostic tool to evaluate the partial pressures of gas in blood and acid-base content. Understanding and using blood gas analysis enables providers to interpret respiratory, circulatory, and metabolic disorders.[1]
A "blood gas analysis" can be performed on blood obtained from anywhere in the circulatory system (artery, vein, or capillary). An arterial blood gas (ABG) explicitly tests blood taken from an artery. ABG analysis assesses the patient's partial pressures of oxygen (PaO2) and carbon dioxide (PaCO2).[2] PaO2 provides information on the oxygenation status, and PaCO2 offers information on the ventilation status (chronic or acute respiratory failure). PaCO2 is affected by hyperventilation (rapid or deep breathing), hypoventilation (slow or shallow breathing), and acid-base status.[3] Although oxygenation and ventilation can be assessed non-invasively via pulse oximetry and end-tidal carbon dioxide monitoring, respectively, ABG analysis is the standard.[4]
When assessing the acid-base balance, most ABG analyzers measure the pH and PaCO2 directly.[2] A derivative of the Hasselbach equation calculates the serum bicarbonate (HCO3) and base deficit or excess. This calculation frequently results in a discrepancy from the measured value due to the blood CO2 unaccounted for by the equation.[5] The measured HCO3 uses a strong alkali that liberates all CO2 in serum, including dissolved CO2, carbamino compounds, and carbonic acid.[6] The calculation only accounts for dissolved CO2; this measurement uses a standard chemistry analysis and will likely be called a "total CO2". Therefore, the difference will amount to around 1.2 mmol/L. However, a more considerable difference may be seen in the ABG compared to the measured value, especially in critically ill patients.[7]
The calculation has been disputed as both accurate and inaccurate based on the study, machine, or calibration used and must be interpreted appropriately based on institutional standards.[6]
Emergency medicine, intensivist, anesthesiology, and pulmonology clinicians frequently order arterial blood gases, which may also be used in other clinical settings. Healthcare professionals evaluate many diseases using an ABG, including acute respiratory distress syndrome (ARDS), severe sepsis, septic shock, hypovolemic shock, diabetic ketoacidosis, renal tubular acidosis, acute respiratory failure, heart failure, cardiac arrest, asthma, and inborn errors of metabolism.[3]
Pathophysiology
By obtaining an ABG and analyzing the pH, partial pressures, and comparing it to measured serum bicarbonate in a sick patient, multiple pathological conditions can be diagnosed.[1] The alveolar-arterial oxygen gradient is a useful measure of lung gas exchange, which can be abnormal in patients with a ventilation-perfusion mismatch.[8]
Specimen Requirements and Procedure
Whole blood is the required specimen for an arterial blood gas sample. The specimen is obtained through an arterial puncture or acquired from an indwelling arterial catheter. A description of these procedures is beyond the scope of this article; please refer to the StatPearls article “Arterial Lines” and other references for more information. Once obtained, the arterial blood sample should be placed on ice and analyzed as soon as possible to reduce the possibility of erroneous results.[9]
Differences in measured blood gas values between arterial and venous blood are most pronounced for PO2, as PO2 is the only clinical reason for obtaining arterial collections.[10] PO2 is generally approximately 60 mm Hg lower in venous blood after O2 is released in the capillaries, whereas PCO2 is 2 to 8 mm Hg higher in venous blood. pH is generally only 0.02 to 0.05 pH units lower in a venous sample.[11] Proper specimen collection is paramount in obtaining accurate blood analysis results for gas and pH. Placement of indwelling catheters with heparin locks for short- and long-term intravenous therapies is typical. Failure to flush the lock properly has unpredictable effects on measured quantities and is often indicated by bizarre, non-physiologic results.[12]
Arterial or venous specimens must be collected anaerobically with lyophilized heparin anticoagulant in 1- to 3-mL sterile syringes. Evacuated lithium heparin sample tubes (vacuum tubes) used for plasma collection are not acceptable for analysis as these evacuated tubes still contain a significant amount of oxygen and will impact the accuracy of the measured whole blood PO2.[13] Syringes containing lyophilized heparin are preferable to those containing liquid heparin, as liquid heparin has atmospheric PO2 and PCO2 values that dilute the sample; when the syringe is not filled, the effect is most significant.[14] An increasing ratio of liquid heparin to blood can have an increasingly marked effect on measured PCO2 and the parameters calculated from it. Variations in syringe manufacturing can create significant differences in pre-analytical effects on the sample.[15]
The anaerobic collection technique means no blood exposure to atmospheric air.[16] The PCO2 of air is approximately 0.25 mm Hg, much less than that of blood (40 mm Hg). Thus, the CO2 content and PCO2 of blood exposed to air will decrease, and blood pH, a function of PCO2, will rise. The PO2 of atmospheric air (155 mm Hg) is approximately 60 mm Hg higher than that of arterial blood and approximately 100 mm Hg higher than venous blood. Hence, blood exposed to atmospheric air in a patient’s breathing room absorbs oxygen, while blood with a PO2 exceeding 150 mm Hg, a condition observed in patients undergoing oxygen therapy, releases oxygen.[17]
Blood exposure to air can occur simply from the air in the needle and the syringe hub dead space. The error will be minimal if the resulting bubble is ejected immediately after drawing by holding the syringe tip up and ejecting a small drop of blood.[18] The potential effect of small bubbles on blood gas results was demonstrated in one study in which a 100-mL bubble of room air was added to 10, 2-mL blood samples with PO2 values between 25 and 40 mm Hg. PO2 increased an average of 4 mm Hg in these samples in only 2 minutes, whereas PCO2 decreased by 4 mm Hg. Before analysis, mixing the sample by vigorously rolling the syringe between the palms should be done to establish a homogeneous sample.[19] Arterialized capillary blood is sometimes an acceptable alternative to arterial blood when an arterial cannula is unavailable or repeated arterial punctures must be avoided.[20]
Automated blood gas analyzers are commonly used to analyze blood gas samples, and results are obtained within 10 to 15 minutes. Automated blood gas analyzers, directly and indirectly, measure specific components of the arterial blood gas sample (see above).[1]
ABG components include the following:
- pH = measured acid-base balance of the blood
- PaO2 = measured the partial pressure of oxygen in arterial blood
- PaCO2 = measured the partial pressure of carbon dioxide in arterial blood
- HCO3 = calculated concentration of bicarbonate in arterial blood
- Base excess/deficit = calculated relative excess or deficit of base in arterial blood
- SaO2 = calculated arterial oxygen saturation (unless a co-oximetry is obtained, in which case it is measured)
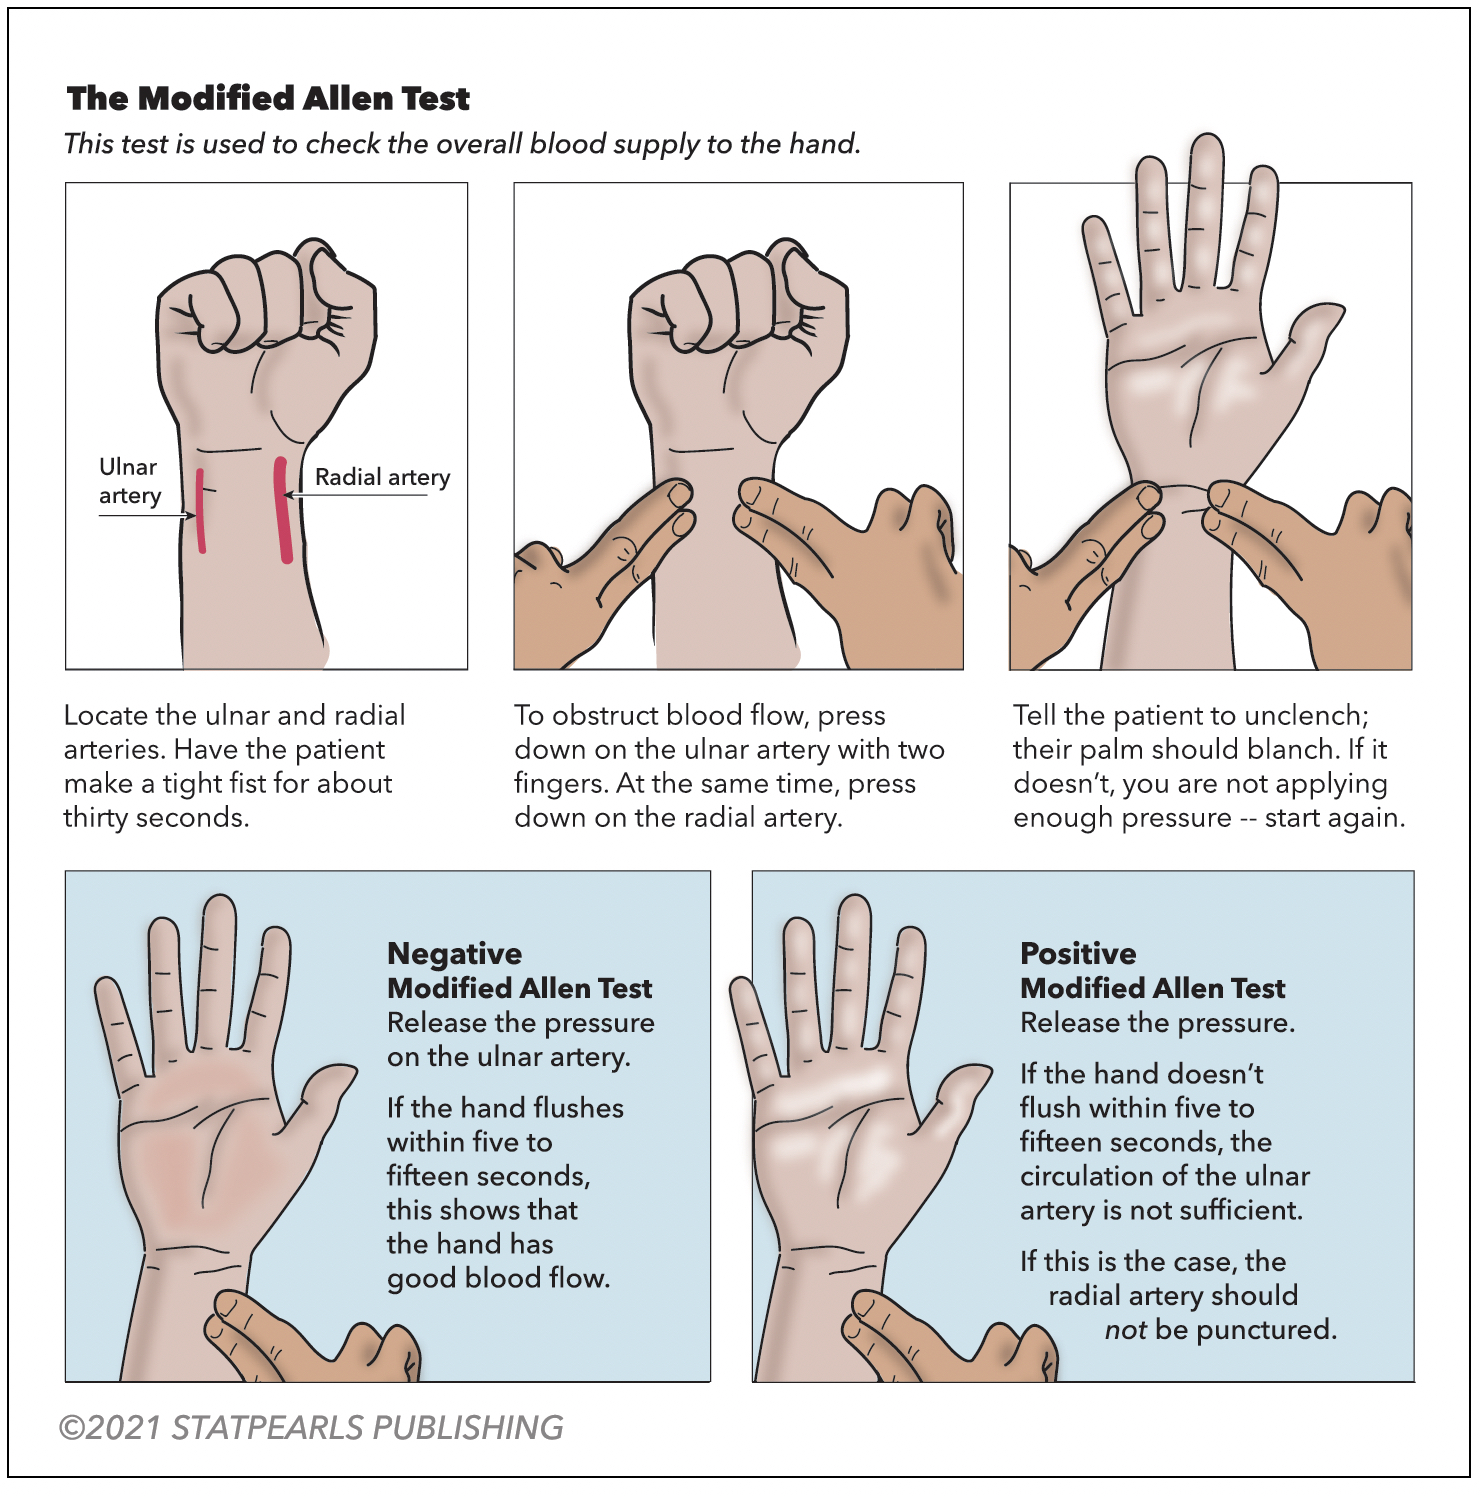
A modified Allen test is necessary before an ABG is drawn from either upper extremity to check for adequate collateral flow. Alternatively, use pulse oximetry and duplex ultrasound. The arterial site commonly used is the radial artery, which is superficial and easily palpable over the radial styloid process. The next most common site is the femoral artery. The test is performed on the unilateral upper extremity chosen for the procedure (see Figure 1. Modified Allen Test). Have the patient flex the selected upper extremity at the elbow and clench a raised fist for 30 seconds. Apply pressure over the ulnar and radial arteries to occlude the blood flow. After 5 seconds, the patient may unclench the raised fist. The palm will now appear pale, white, or blanched. Then, pressure over the ulnar artery is released while the radial artery compression is maintained. In 10 to 15 seconds, the palm returns to its original color, indicating adequate ulnar collateral blood flow. If the palm does not return to its actual color, it is an abnormal test and unsafe to puncture the radial artery. Similarly, the radial collateral blood flow is assessed by maintaining ulnar artery pressure and releasing the radial artery pressure.[21]
Testing Procedures
Operating a traditional blood gas instrument begins with the operator presenting a blood specimen at the sample probe. The sample is taken through the probe by a peristaltic pump that loads the chamber with a specific amount of the sample. The sample then resides in the chamber long enough to allow thermal equilibration and completion of measurements. On completion of the measurement, the pump pushes the sample to waste.[22] Because electrodes are not stable for very long, frequent calibration of pH, PCO2, and PO2 is required.[23] Most instruments contain a barometer so that barometric pressure P(Amb) is always known to the microprocessor during calibration. Other instruments perform point-of-care or bedside testing. Almost all manufacturers now produce small, portable, stand-alone, easy-to-operate instruments designed for “satellite lab” operations; several hand-held devices that use disposable electrodes are also available.[24]
The sophistication of contemporary equipment and availability of high-quality calibrator materials have made reliable and accurate determination of blood pH and gases primarily due to meticulous maintenance, adherence to the manufacturer’s recommended procedures, control of the equipment, and proper collection and handling of specimens.[22] Software programs of the instrument’s microprocessor often provide display warnings and diagnostic routines that alert the operator and assist in troubleshooting. The manufacturer’s suggested maintenance schedule should be considered a minimum guideline, relying on experience to indicate maintenance frequency.[25]
Cleanliness of the sample chamber and path is essential. Automatic flushing to cleanse the sample chamber and path after each blood sample measurement is a feature of most instruments without disposable electrodes. Despite proper flushing, however, complete or partial clogging of the chamber or path may occur.[1] Fibrin threads and small clots may be present in the specimen or may form while the sample resides in the warm chamber. If allowed to remain, they can affect subsequent measurements or calibrations by interfering with the contact of blood, buffers, or gases with electrode membranes.[18] Visibility of the path through the heat sink helps detect clogs, dirt, and bubbles. Bubbles that fail to rinse out can be problematic if they settle on an electrode.[26]
Results, Reporting, and Critical Findings
An acceptable normal range of ABG values of ABG components is the following,[27][28] noting that the range of normal values may vary among laboratories and in different age groups from neonates to geriatrics:
- pH (7.35-7.45)
- PaO2 (75-100 mm Hg)
- PaCO2 (35-45 mm Hg)
- HCO3 (22-26 mEq/L)
- Base excess/deficit (-4 to +2)
- SaO2 (95-100%)
It is best to approach arterial blood gas interpretation systematically. Interpretation leads to understanding the degree or severity of abnormalities, whether the abnormalities are acute or chronic, and whether the primary disorder is metabolic or respiratory in origin.[29] Several articles have described simplistic ways to interpret ABG results. However, the Romanski method of analysis is most simplistic for all levels of providers. This method helps determine the presence of an acid-base disorder, its primary cause, and whether compensation is present.[30]
The first step is to look at the pH and assess for the presence of acidemia (pH < 7.35) or alkalemia (pH > 7.45). If the pH is in the normal range (7.35-7.45), use a pH of 7.40 as a cutoff point. In other words, categorize a pH of 7.37 as acidosis and a pH of 7.42 as alkalemia. Next, evaluate the respiratory and metabolic components of the ABG results, the PaCO2 and HCO3, respectively. The PaCO2 indicates whether the acidosis or alkalemia is primarily from a respiratory or metabolic acidosis/alkalosis. PaCO2 > 40 with a pH < 7.4 indicates a respiratory acidosis, while PaCO2 < 40 and pH > 7.4 indicates a respiratory alkalosis (but is often from hyperventilation from anxiety or compensation for a metabolic acidosis). Next, assess for evidence of compensation for the primary acidosis or alkalosis by looking for the value (PaCO2 or HCO3) inconsistent with the pH. Lastly, assess the PaO2 for any abnormalities in oxygenation.[29]
Example 1[28]: ABG: pH = 7.39, PaCO2 = 51 mm Hg, PaO2 = 59 mm Hg, HCO3 = 30 mEq/L and SaO2 = 90%, on room air.
- pH is in the normal range, so use 7.40 as a cutoff point, in which case it is < 7.40, and acidosis is present.
- The elevated PaCO2 indicates respiratory acidosis, and the elevated HCO3 indicates a metabolic alkalosis.
- The value consistent with the pH is PaCO2. Therefore, this is a primary respiratory acidosis. The acid-base that is inconsistent with the pH is the elevated HCO3, indicating a metabolic alkalosis, so there is compensation signifying a non-acute primary disorder because it takes days for metabolic compensation to be effective.
- Last, the decreased PaO2 indicates an abnormality with oxygenation. However, a history and physical will help delineate the severity and urgency of required interventions, if any.
Example 2[28]: ABG: pH = 7.45, PaCO2 = 32 mm Hg, PaO2 = 138 mm Hg, HCO3 = 23 mEq/L, the base deficit = 1 mEq/L, and SaO2 is 92%, on room air.
- pH is in the normal range. Using 7.40 as a cutoff point, it is >7.40, so alkalemia is present.
- The decreased PaCO2 indicates a respiratory alkalosis, and the HCO3 is normal but on the low end of normal.
- The value consistent with the pH is PaCO2. Therefore, this is a primary respiratory alkalosis. The HCO3 is in the normal range and, thus, not inconsistent with the pH, so there is a lack of compensation.
- Last, the PaO2 is within the normal range, so there is no abnormality in oxygenation.
When evaluating a patient's acid-base status, it is important to include an electrolyte imbalance or anion gap in synthesizing the information.[31] For example, a patient who presents with diabetic ketoacidosis will eliminate ketones and close the anion gap but with persistent metabolic acidosis due to hyperchloremia due to the strong ionic effect, which is beyond the scope of this article.
Clinical Significance
Arterial blood gas monitoring is the standard for assessing a patient’s oxygenation, ventilation, and acid-base status. Although ABG monitoring has been replaced mainly by non-invasive monitoring, it is still helpful in confirming and calibrating non-invasive monitoring techniques.[1]
Frequently performed is the evaluation of oxygenation in the context of severe sepsis, acute respiratory failure, and ARDS In the intensive care unit (ICU) and emergency room settings. Calculating an alveolar-arterial (A-a) oxygen gradient can aid in narrowing down the hypoxemia cause.[25] For example, a gradient’s presence or absence can help determine whether the abnormality in oxygenation is potentially due to hypoventilation, a shunt, V/Q mismatch, or impaired diffusion. The equation for the expected A-a gradient assumes the patient is breathing room air; therefore, the A-a gradient is less accurate at higher percentages of inspired oxygen. Determining the intrapulmonary shunt fraction, the fraction of cardiac output flowing through pulmonary units that do not contribute to gas exchange, is the best estimate of oxygenation status. Calculating the shunt fraction is traditionally done at a delivered FiO2 of 1.0, but if performed at a FiO2 lower than 1.0, venous admixture would be the more appropriate term.[1]
For simplicity, assessing oxygenation is more commonly performed by computing the ratio of PaO2 and the fraction of inspired oxygen (PaO2/FiO2 or P/F ratio). However, there are limitations in using the P/F ratio in assessing oxygenation, as the discrepancy between venous admixture and the P/F ratio at a given shunt fraction depends on the delivered FiO2. Researchers use the P/F ratio to categorize disease severity in ARDS.[32]
Another parameter commonly used in ICUs to assess oxygenation is the oxygenation index (OI). This index is considered a better indicator of lung injury, particularly in the neonatal and pediatric population, compared to the P/F ratio. This index also includes the level of invasive ventilatory support required to maintain oxygenation.[33] The OI is the product of the mean airway pressure (Paw) in cm H2O, measured by the ventilator, and the FiO2 is the percentage divided by the PaO2. The OI is commonly used to guide management, such as initiating inhaled nitric oxide, administering surfactant, and defining the potential need for extracorporeal membrane oxygenation.[34]
A normal PaO2 value does not rule out respiratory failure, particularly in the presence of supplemental oxygen. The PaCO2 reflects pulmonary ventilation and cellular CO2 production. It is a more sensitive marker of ventilatory failure than PaO2, particularly in the presence of supplemental oxygen, as it is closely related to the depth and rate of breathing.[27] Calculating the pulmonary dead space is a good indicator of overall lung function. Pulmonary dead space is the difference between the PaCO2 and mixed expired PCO2 (physiological dead space) or the end-tidal PCO2 divided by the PaCO2. Pulmonary dead space increases when the pulmonary units’ ventilation increases relative to their perfusion, and shunting increases. Hence, pulmonary dead space is an excellent bedside indicator of lung function and one of the best prognostic factors in ARDS patients.[1] The pulmonary dead space fraction may also help diagnose other conditions, such as pulmonary embolism.[35]
Acid-base balance can be affected by the aforementioned respiratory system abnormalities. For instance, acute respiratory acidosis and alkalemia result in acidemia and alkalemia, respectively. Additionally, hypoxemic hypoxia leads to anaerobic metabolism, which causes metabolic acidosis that results in acidemia. Metabolic system abnormalities also affect acid balance, as acute metabolic acidosis and alkalosis result in acidemia and alkalemia.[25] Patients with diabetic ketoacidosis, septic shock, renal failure, drug or toxin ingestion, and gastrointestinal or renal HCO3 loss exhibit metabolic acidosis.[28] Conditions such as kidney disease, electrolyte imbalances, prolonged vomiting, hypovolemia, diuretic use, and hypokalemia cause metabolic alkalosis.[36]
Quality Control and Lab Safety
Healthcare providers can analyze an arterial blood gas and electrolytes (often called a shock panel) as a point-of-care test. Appropriately calibrate or standardize these machines to ensure accurate and precise readings for clinical decisions. Please refer to the user manuals to ensure the appropriate device calibration during discussion with the clinical laboratory team.[37]
Elements of good quality assurance of blood gas and pH measurements include the following:
- Proper maintenance of the instrument
- Use of control materials
- Verification of electrode linearity
- Checking barometer accuracy
- Accurately measuring temperature.[38]
External quality assurance (proficiency testing) mandated by federal law in the United States (Clinical Laboratory Improvement Amendments [CLIA] 1988) has assumed new importance for quality control of blood gas analysis.[39] These rules became effective in January 1991 and set criteria for satisfactory interlaboratory performance, which are as follows: pH, target value ±0.04; PO2, target value ±3 SD; and PCO2, target value ±8% or ±5 mm Hg, whichever is greater.[40] The significance of proficiency testing and the penalties for failure place strong incentives on consistent performance of internal control measures and effective response to quality control failures.[41]
At the same time, the pressure to control costs has raised the question of how often one should monitor interlaboratory performance effectively and determine the necessary concentrations of control materials. Per CLIA 1988, the answer is one concentration of control every 8 hours, with the entire range of control concentrations covered every 24 hours.[22] In many laboratories, however, the practical answer is to run on every instrument in use, at least once per shift, three concentrations of control for pH, PO2, and PCO2, always on completion of maintenance and troubleshooting procedures. Newer analyzers, particularly the smaller satellite laboratory and point-of-care instruments, frequently have an auto quality control (QC) feature or use electronic QCs.[42]
Auto QC consists of onboard QC material automatically analyzed by the instrument at designated intervals to fulfill regulatory requirements. Electronic QC, which is most common in devices with disposable electrode cartridges, consists of cartridges that verify the electronic specification of the instruments.[43]
Enhancing Healthcare Team Outcomes
ABG should be used to assess a patient's ventilatory, acid-base, and oxygenation status. Additionally, blood gas analysis is recommended to assess a patient's response to therapeutic interventions and to monitor the severity and progression of documented cardiopulmonary disease processes.[44] Despite its clinical value, erroneous or discrepant values represent a potential drawback of blood gas analysis, so eliminating potential sources of error is paramount.[27] Therefore, attention to detail in the sampling technique and processing is essential.
Rigorous quality control of the automated blood gas analyzers is also necessary for accurate results. However, machine performance and quality assurance advances have now made most errors in point-of-care analysis of ABGs attributable to clinical providers. Several pre-analytic steps must be followed to obtain a valid, interpretable ABG.[27] In most hospital settings, ABG analysis is a process that involves multiple healthcare providers (eg, physicians, respiratory therapists, and nurses). Hence, interprofessional coordination, cooperation, and communication are vitally important.
The American Association for Respiratory Care has published Clinical Care Guidelines for Blood Gas Analysis and Hemoximetry that provide current best practices for sampling, handling, and analyzing ABGs.[44] Notable sources of erroneous values during blood draws include abnormal or misstated FiO2, barometric pressures, or temperatures. Temperature is a significant variable, leading to PaO2 and O2 saturation discrepancies, as do acid-base disturbances. Several physiological and clinical conditions, such as hyperleukocytosis and dyshemoglobinemias, can also lead to PaO2 and O2 saturation discrepancies. Sample dilution can be an additional error source, with liquid heparin and saline as potential culprits.[45]
The mode of sample transportation is also of significance as discrepant values can result from air contamination after pneumatic tube system transport, compared with manual transport of the specimen, especially in the presence of inadvertent air bubbles.[45] Therefore, procuring samples using suitable syringes filled with adequate amounts of blood without air bubbles, maintained at the correct temperatures, and appropriately and promptly transporting them for rapid analysis can minimize erroneous values.