Introduction
Relative risk is a ratio of the probability of an event occurring in the exposed group versus the probability of the event occurring in the non-exposed group. For example, the relative risk of developing lung cancer (event) in smokers (exposed group) versus non-smokers (non-exposed group) would be the probability of developing lung cancer for smokers divided by the probability of developing lung cancer for nonsmokers. The relative risk does not provide any information about the absolute risk of the event occurring, but rather the higher or lower likelihood of the event in the exposure versus the non-exposure group.[1][2]
Function
Relative Risk = (Probability of event in exposed group) / (Probability of event in not exposed group)[1]
An example will help clarify this formula.
If we hypothetically find that 17% of smokers develop lung cancer and 1% of non-smokers develop lung cancer, then we can calculate the relative risk of lung cancer in smokers versus non-smokers as:
Relative Risk = 17% / 1% = 17
Thus, smokers are 17 times more likely to develop lung cancer than non-smokers.
A second example involves a study of a new medicine. Fourteen of the volunteers who were given the new medicine have an upset stomach, and 42 of the volunteers who were given the new medicine do not have an upset stomach. In volunteers who did not take the medication, two people have an upset stomach, and 83 do not have an upset stomach.
To calculate the relative risk (RR), first, calculate the probability of having an upset stomach with exposure to the new medication. Fourteen people have an upset stomach who were exposed, and 42 people do not have an upset stomach who were exposed. Thus, the probability of having an upset stomach in the exposed group is as follows:
Probability in exposure group = 14 / (14+42) = 14 / 56 = 0.25
Note the probability is the probability of having an upset stomach in all individuals in the exposure group, both those with and without an upset stomach who took the new medicine. Next, we calculate the probability of an upset stomach in the non-exposure group.
Probability in non-exposure group = 2 / (2 + 83) = 2 / 85 = 0.024
Now we can calculate the relative risk of having an upset stomach (event) after taking the new medicine (exposure).
Relative Risk = 0.25 / 0.024 = 10.4
Thus, it is 10.4 times more likely to have an upset stomach after taking the new medicine in this study than if you did not take the new medicine in the study.
Exposure can also provide benefits and decrease the risk of the event. A survey of a group of people finds that 40% of those who perform moderate exercise are overweight or obese, and 70% of those who do not perform moderate exercise are overweight or obese. In this example, the event is "overweight or obese, " and the exposure is "moderate exercise." Then relative risk is calculated as:
Relative risk = 40% / 70% = 0.57
Thus, the group looked is 0.57 times as likely to be overweight or obese if an individual performs moderate exercise. Stated another way, one is 43% less likely (0.43 = 1 – 0.57) to be overweight or obese in the surveyed population if moderate exercise is performed. When the event is an improvement in health due to a health exposure, then the relative benefit is usually reported rather than the relative risk. The relative benefit is 1 – relative risk.
A relative risk of one implies there is no difference of the event if the exposure has or has not occurred. If the relative risk is greater than 1, then the event is more likely to occur if there was exposure. If the relative risk is less than 1, then the event is less likely to occur if there was exposure.
Issues of Concern
The relative risk is confused by some with the odds ratio and absolute risk. Relative risk is the ratio of the probability of an event occurring with an exposure versus the probability of the event occurring without the exposure. Thus to calculate the relative risk, we must know the exposure status of all individuals (either exposed or not exposed). This implies that relative risk is only appropriate for cases where the exposure status and incidence of disease can be accurately determined, such as prospective cohort studies.[1][3][2]
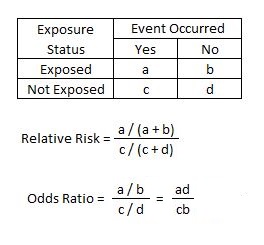
The odds ratio compares the odds of some event in an exposed group versus the odds in a non-exposed group and is calculated as the number of events / the number of non-events. Stated another way, if the probability of an event is P, then the odds ratio would be P / (1 – P). In a two-by-two table with cells a, b, c, and d then the odds ratio is odds of the event in the exposure group (a/b) divided by the odds of the event in the control or non-exposure group (c/d). Thus the odds ratio is (a/b) / (c/d) which simplifies to ad/bc. This is compared to the relative risk which is (a / (a+b)) / (c / (c+d)). If the disease condition (event) is rare, then the odds ratio and relative risk may be comparable, but the odds ratio will overestimate the risk if the disease is more common. In such cases, the odds ratio should be avoided, and the relative risk will be a more accurate estimation of risk.
Absolute risk is the actual risk of some event happening given the current exposure. For example, if 1 in 10 individuals with exposure develops the disease, then the absolute risk of developing the disease with exposure is 10% or 1:10. If only 1 in 100 individuals without exposure develop the disease, then the absolute risk for developing the disease without exposure would be 1% or 1:100. Thus the relative risk of developing the disease would be 0.1 / 0.01 = 10. Therefore, an individual has a 10% chance of developing the disease with exposure (absolute risk), a 1% chance of developing the disease without exposure (absolute risk), and they are 10 times more likely to develop the disease if they have exposure (relative risk).[4][5]
Finally, very small numbers can create large changes in relative risk but small changes in absolute risk. The annual risk for seizure (event) in the general population (non-exposure) is around 0.057%. Certain medications can lower the seizure threshold and increase the likelihood of a seizure. Taking one specific medication (exposure) increases the annual risk of seizure (event) to 0.16%. Thus the relative risk of seizure when taking the specific medication is 2.8 (2.8 = 0.16 / 0.057). A person is 2.8 times more likely to have a seizure when taking the specific medication, but that is only a 0.103% increase in absolute risk (1 in 1000 increase in absolute risk).
Clinical Significance
Relative risk is the ratio of the risks for an event for the exposure group to the risks for the non-exposure group. Thus relative risk provides an increase or decrease in the likelihood of an event based on some exposure. Relative risk has the benefit of being a ratio of risks which means it can be applied to populations with differing disease prevalence. Relative risk does not specify the absolute risk of the event occurring.