Introduction
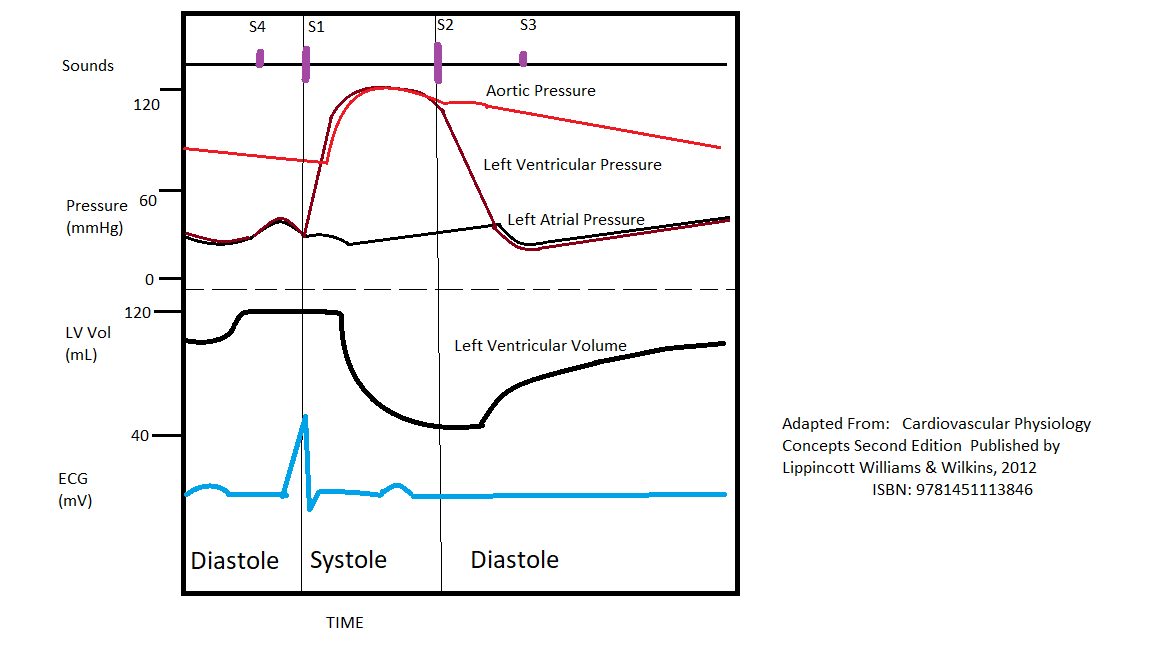
The cardiac cycle is a series of pressure changes that take place within the heart. These pressure changes result in the movement of blood through different chambers of the heart and the body as a whole. These pressure changes originate as conductive electrochemical changes within the myocardium that result in the concentric contraction of cardiac muscle. Valves within the heart direct blood movement, which leads to the organized propulsion of blood to the next chamber. This rhythmic sequence causes changes in pressure and volume that are often seen graphically in the form of a Wiggers diagram or venous pressure tracings (see Image. Wiggers Diagram). Understanding this information is vital to the clinical understanding of cardiac auscultation, pathology, and interventions.
Cellular Level
Cardiac excitation and contraction directly result in the changes in pressure and volume. The pressure and volume changes are directly related to Ca++ ions entering the myocytes perpetuating conduction. Due to this conduction originating at the sinoatrial (SA) node, the atria contract together and then, after a short pause at the atrioventricular (AV) node, the two ventricles contract together. These contractions come after a slight “lag” concerning the electrical conduction that makes them possible. This lag is due to a time gap between the electrical conduction and the actual application of the myocardial force. In other words, though the depolarization has gone through the myocardium (the ECG tracing), there is little or no contraction because the depolarization read as the electrical signal is the very beginning of the muscle’s movement. This is well-illustrated on a Wiggers diagram where the QRS complex on the ECG directly precedes ventricular systole (represented on the diagram by increased ventricular pressure).[1][2][3][4]
Function
Concerning the events of the cardiac cycle, it is important to compartmentalize their sequence. The contraction of the atria (both the right and left) physiologically precede that of the ventricles (both right and left). This contraction sequence allows the separation of the right and left heart, at least functionally, as two separate circuits. Due to this functional similarity between the right and left side, this article will often only comment on the left ventricle, with it known that a similar sequence of events is taking place in the right heart as well.
Cardiac cycle events can be divided into diastole and systole. Diastole represents ventricular filling, and systole represents ventricular contraction/ejection. Systole and diastole occur in both the right and left heart, though with very different pressures (see hemodynamics below).
Diastole begins with the closing of the aortic valve (or pulmonic) and ends with the closing of the mitral valve (or tricuspid). This period encompasses the ventricular relaxation and filling. Diastole represents when the blood vessels return blood to the heart in preparation for the next ventricular contraction.
Systole begins when the mitral valve (or tricuspid) closes and concludes with the closure of the aortic valve (or pulmonic). This stage of the cardiac cycle represents ventricular contraction, forcing blood into the arteries. When a ventricle contracts, the pressure within the ventricles will (barring pathology) become greater than adjacent blood vessels, and the valves will allow the blood out.[5][6]
Mechanism
Hemodynamics
A detailed look at the ventricular filling and contraction can be visualized on a pressure-volume curve with the pressure on the Y-axis and the volume on the X-axis. Frequently, this only represents the left ventricle, but an analogous process occurs in the right ventricle, albeit at much lower pressures.
The ventricular function can be divided into four phases: isovolumic relaxation, ventricular filling, isovolumic contraction, and rapid ventricular ejection. Isovolumic relaxation is the period immediately after ventricular contraction when the aortic valve has closed, but the mitral valve has not yet opened. This period represents a time of very low pressure in the ventricle, which helps create the gradient, which opens the mitral valve. The mitral valve opens, signifying the beginning of ventricular filling where the high pressure from the blood vessels forces blood into the expanding ventricle. After the ventricle fills and transitions to contracting, the pressure eventually exceeds that of the blood vessels. This gradient closes the mitral valve, which marks the beginning of systole and causes the first heart sound (in concert with the tricuspid valve), denoted as S1. The time between this closing of the mitral valve and the opening of the aortic valve is the isovolumic contraction period. This is where pressure builds, yet the blood does not leave the ventricle. Eventually, the pressure within the ventricle exceeds the pressure in the arteries, and the aortic valve opens, marking the beginning of rapid ventricular ejection. A healthy ventricle will eject more than 60% of its volume, and after the aortic valve closes, the cycle begins again. The aortic valve closure is the source of the second heart sound (in concert with the pulmonic valve) denoted as S2.
The energy propelling the blood into the ventricle during diastole is derived from the potential energy from the elasticity of the blood vessels. During systole, the blood vessels are distended by the heart forcing blood from the ventricles into the systemic (or pulmonic) system. This energy is stored in the blood vessel walls like an elastic tube. The blood vessels now contain blood under higher pressure than the ventricles due to a combination of that elasticity and ventricular relaxation.
Heart Chamber (Max/Min Pressure in mmHg)
- Left ventricle (120/15)
- Right ventricle (25/5)
- Right atria (mean 4 to 5)
- Pulmonary arteries/left atria (25/10)
- Aorta (120/80)
Pathophysiology
One of the most clinically relevant examples of altering the normal cardiac cycle is heart failure. Heart failure represents a decreased functioning of the ventricles. This pathology can be classified as right ventricular, left ventricular, or both, as well as diastolic or systolic. Systolic heart failure represents a dilation of the left ventricle and a decreased ability to contract during the ventricular contraction phase of the cycle. Diastolic heart failure represents sufficient contraction, but poor distention of the myocardium. This lack of lusitropy (the rate of relaxation) is often a result of a thickened myocardium. Regardless of the cause, the symptoms of heart failure depend on the compartment preceding the area of backup. For example, left heart failure can result in pulmonary symptoms such as shortness of breath or abnormal lung sounds. Alternatively, right heart failure results in systemic symptoms such as pedal edema. While structural abnormalities in the myocardium typically characterize congestive heart failure, some of these symptoms may be present in any pathology that alters flow between cardiac chambers and subsequent cardiac output. Myocardial infarction, arrhythmias, or vascular disease can all compromise the cardiac cycle's normal function, albeit with slightly different clinical pictures.[7]
Similarly, valve defects can affect blood flow between cardiac compartments. Incompetent valves fail to direct the flow in the proper direction, and stiff/stenotic valves fail to allow proper blood flow to the next chamber. When the valve defects are severe enough, a clinical picture emerges resembling our discussion of heart failure. As in heart failure, incompetent valves decrease forward flow and can result in a backup of blood. Another series of conditions that compromise normal blood flow within the heart and corrupt the normal cardiac cycle are developmental anomalies. Of note, ventricular septal defects (VSDs) cause flow through the normally impermeable ventricular septum due to the incomplete closure. This typically results in blood moving from the left ventricle to the right ventricle and slightly decreased forward flow. If allowed to persist, the shunt can reverse due to right ventricular remodeling (Eisenmenger syndrome), causing reduced blood flow to the lungs.
Clinical Significance
Physical Exam and Auscultation
Cardiac auscultation is performed in virtually every form of doctor-patient interaction. The physician listens to the heart sounds, rate, and rhythm. If murmurs are detected during this examination, it can be determined if the murmur takes place in systole (between S1 and S2) or diastole (after S2 and before the next S1). Determining the timing of murmurs can help narrow down an otherwise broad differential. For example, a murmur determined to be systolic rules out diastolic murmur causes such as mitral stenosis and aortic regurgitation. As a general rule, systolic murmurs involve blood leaving the ventricle (e.g., mitral regurgitation, aortic stenosis, HOCM), and diastolic murmurs involve blood entering the ventricles (mitral stenosis, aortic regurgitation).
The symptomatology of various cardiac pathology may be evident on physical examination by methods other than auscultation. Palpation and simple observation can reveal alterations to the normal pressure-contraction cycling of the heart. Palpation of the distal extremities for temperature and the presence of edema is a rapid bedside maneuver. One can also inspect the neck for jugular venous distention. Because the jugular veins are continuous with the right atria, their distention can be used as a rough estimation of the right atrial pressure. An elevated right atrial pressure can correlate to pathologies such as arrhythmia or poor cardiac output. One striking example occurs in congestive heart failure, where poor forward flow causes a backup into preceding cardiac chambers.
Cardiac Imaging
An understanding of the cardiac cycle is vital to the interpretation of cardiac imaging. In particular, one of the most direct methods for cardiac imaging is the echocardiogram. This ultrasound-based technology allows representative visualization of cardiac wall motion, valve function, and blood flow. Using this type of imaging, and comparing the results to the normal physiological principles stated above, one can identify pathologies such as heart failure, pericardial effusion, or aberrant valves. These pathologies will demonstrate altered blood flow and chamber pressures and are discussed below.