Continuing Education Activity
The full-field electroretinogram (ffERG) is a specialized electrophysiologic test of retinal function in response to a full-field light stimulus. There are 6 standard protocols for isolating the electrical activity from the rods and cones. The ffERG is a valuable tool for objectively diagnosing and monitoring retinal disease. This activity reviews the ffERG procedure and technique and highlights the role of the interprofessional team in improving care for patients using this procedure.
Objectives:
- Identify the indications for ffERG.
- Describe the typical ffERG findings associated with rod-cone dystrophy.
- Review the interfering factors of the ffERG.
- Explain the importance of collaboration and communication amongst the interprofessional team to enhance the delivery of care for patients affected by retinal disease using ffERG.
Introduction
The full-field electroretinogram (ffERG) is an ophthalmologic test that provides non-invasive objective quantitative measures of the electrical activity in the retina. The ffERG represents an electrical response from the retina to a flash of light and measures global retinal function.[1] Analysis of the ffERG waveform components can provide useful diagnostic information for distinguishing various retinal diseases, especially when the etiology of vision loss remains unclear following standard ophthalmologic clinical examination.
Anatomy and Physiology
The retina is organized into 10 layers comprising various cell types and synaptic connections important for visual processing. The inner retina includes ganglion cells and amacrine cells, whereas the outer retina includes the rod and cone photoreceptors. The primary role of photoreceptors is to convert light energy into an electrical signal (phototransduction). The photoreceptors transmit visual information to second-order neurons known as bipolar cells in the middle retina. Rods synapse only with depolarizing bipolar cells, while cones synapse with both depolarizing and hyperpolarizing bipolar cells.[1] The ganglion cells ultimately transmit this electrical information to the brain via the optic nerve. The ratio of rods to cones in the retina is 3:1. However, cones dominate the area of the retina responsible for visual acuity, also known as the macula, and are found in the highest concentrations in the central macula or fovea. The total number of cones outside of the macula is greater than the number in the macula due to the amount of surface area of the retina outside of this area. These photoreceptors also vary in spectral characteristics, including signal threshold, peak wavelength sensitivity, and rate of recovery. Peak sensitivity for rods and cones is approximately 510 and 560 nm, respectively. In addition, rods may be more sensitive than cones. However, cones recover faster.[2][3]
Indications
The ffERG is a specialized test beyond standard ophthalmologic examination. Electrophysiologic testing may be indicated in the following scenarios:[2]
- Diagnose and follow optic nerve and retinal diseases
- Monitor retinal disease from toxic drug exposure
- Assess intraocular inflammation
- Evaluation of the construct of intraocular foreign bodies
- Evaluation of retinal vascular occlusions and associated ischemic damage
- Evaluation of malingering or hysteria
Contraindications
There are no specific contraindications for the ffERG. Patients with seizure disorders can safely undergo the ffERG as the stimulus frequency is outside of the range, responsible for inducing most epileptic seizures. Patients who report photosensitive seizures should be evaluated with caution if the frequency which induces their seizures is around 30 Hz or is unknown.
Equipment
- Electrodes
- Ganzfield stimulator
- Digital recording system
Personnel
Appropriately trained technicians perform ffERG in large referral centers equipped with an electrophysiology laboratory. Retina specialists and neuro-ophthalmologists are typically responsible for the interpretation of the electrophysiological results.
Preparation
Electrode Placement
Recording Electrodes
- Depending on the type of electrode, the recording electrode is placed on the corneal surface, on the bulbar conjunctiva adjacent to the inferior limbus of the cornea, or on the skin of the lower eyelids.
- Artificial tears or other non-irritating ionic conductive solution is used to protect the corneal surface.
- Topical anesthesia is applied to minimize ocular surface discomfort with corneal contact electrodes.
- The electrode is connected to the positive terminal of the recording system.
Reference Electrodes
- Connect to the negative input of the recording system
Ground Electrodes
- Placed on the earlobe, mastoid, or forehead and connected to the ground input of the recording system
Patient Preparation
Per the International Society for Clinical Electrophysiology of Vision (ISCEV) guidelines:
- Electrically isolated recording environment
- Maximal pupil dilation
- Minimum 20-minutes of dark adaptation before performing dark-adapted ERGs
- Minimum 10-minutes of light adaptation before performing light-adapted ERGs
- Present stronger flashes after low strength flashes to avoid partial light adaptation from bright light
- Insert corneal contact electrodes or adjust the recording electrode under dim red light after dark adaptation. Avoid strong red light. Allow an additional 5-minutes of dark adaptation following corneal electrode placement
- Minimum 30-minutes of recovery time in normal room lighting is required for patients exposed to strong light stimuli from alternative imaging techniques (i.e., fundus photography or fluorescein angiography)
- Instruct patients to fixate on a target within the stimulator while minimizing eye movement. Patients who are unable to see the fixation point may be advised to look straight ahead while maintaining a steady gaze.[4]
Technique or Treatment
The ffERG measures the light-induced electrical activity of the retina at the corneal surface. Specifically, the ffERG records the global or total retinal electrical response to a full-field (Ganzfield) light stimulus. Isolation of the rod and cone components has important diagnostic value in differentiating between various retinal diseases. Modifying the properties of the light-stimulus (wavelength, strength, and flicker rate) as well as the adaptive state of the retina can separate the rod and cone functions of the ffERG.[5]
Waveform Components
a-wave
The a-wave is the initial negative deflection corresponding to the early hyperpolarization of the rod and cone photoreceptors. This wave-component reflects outer retinal function.
b-wave
The b-wave is the positive deflection following the a-wave that originates from the depolarization of inner retinal Muller and bipolar cells. This wave-component reflects phototransduction activity.
Oscillatory potentials
Oscillatory potentials (OPs) are high-frequency rhythmic wavelets seen on the rising slope of the b-wave. OPs are visible at greater signal intensities and reflect the electrical activity of inner retinal feedback synaptic circuits, namely amacrine cells, as well as some vascular function.
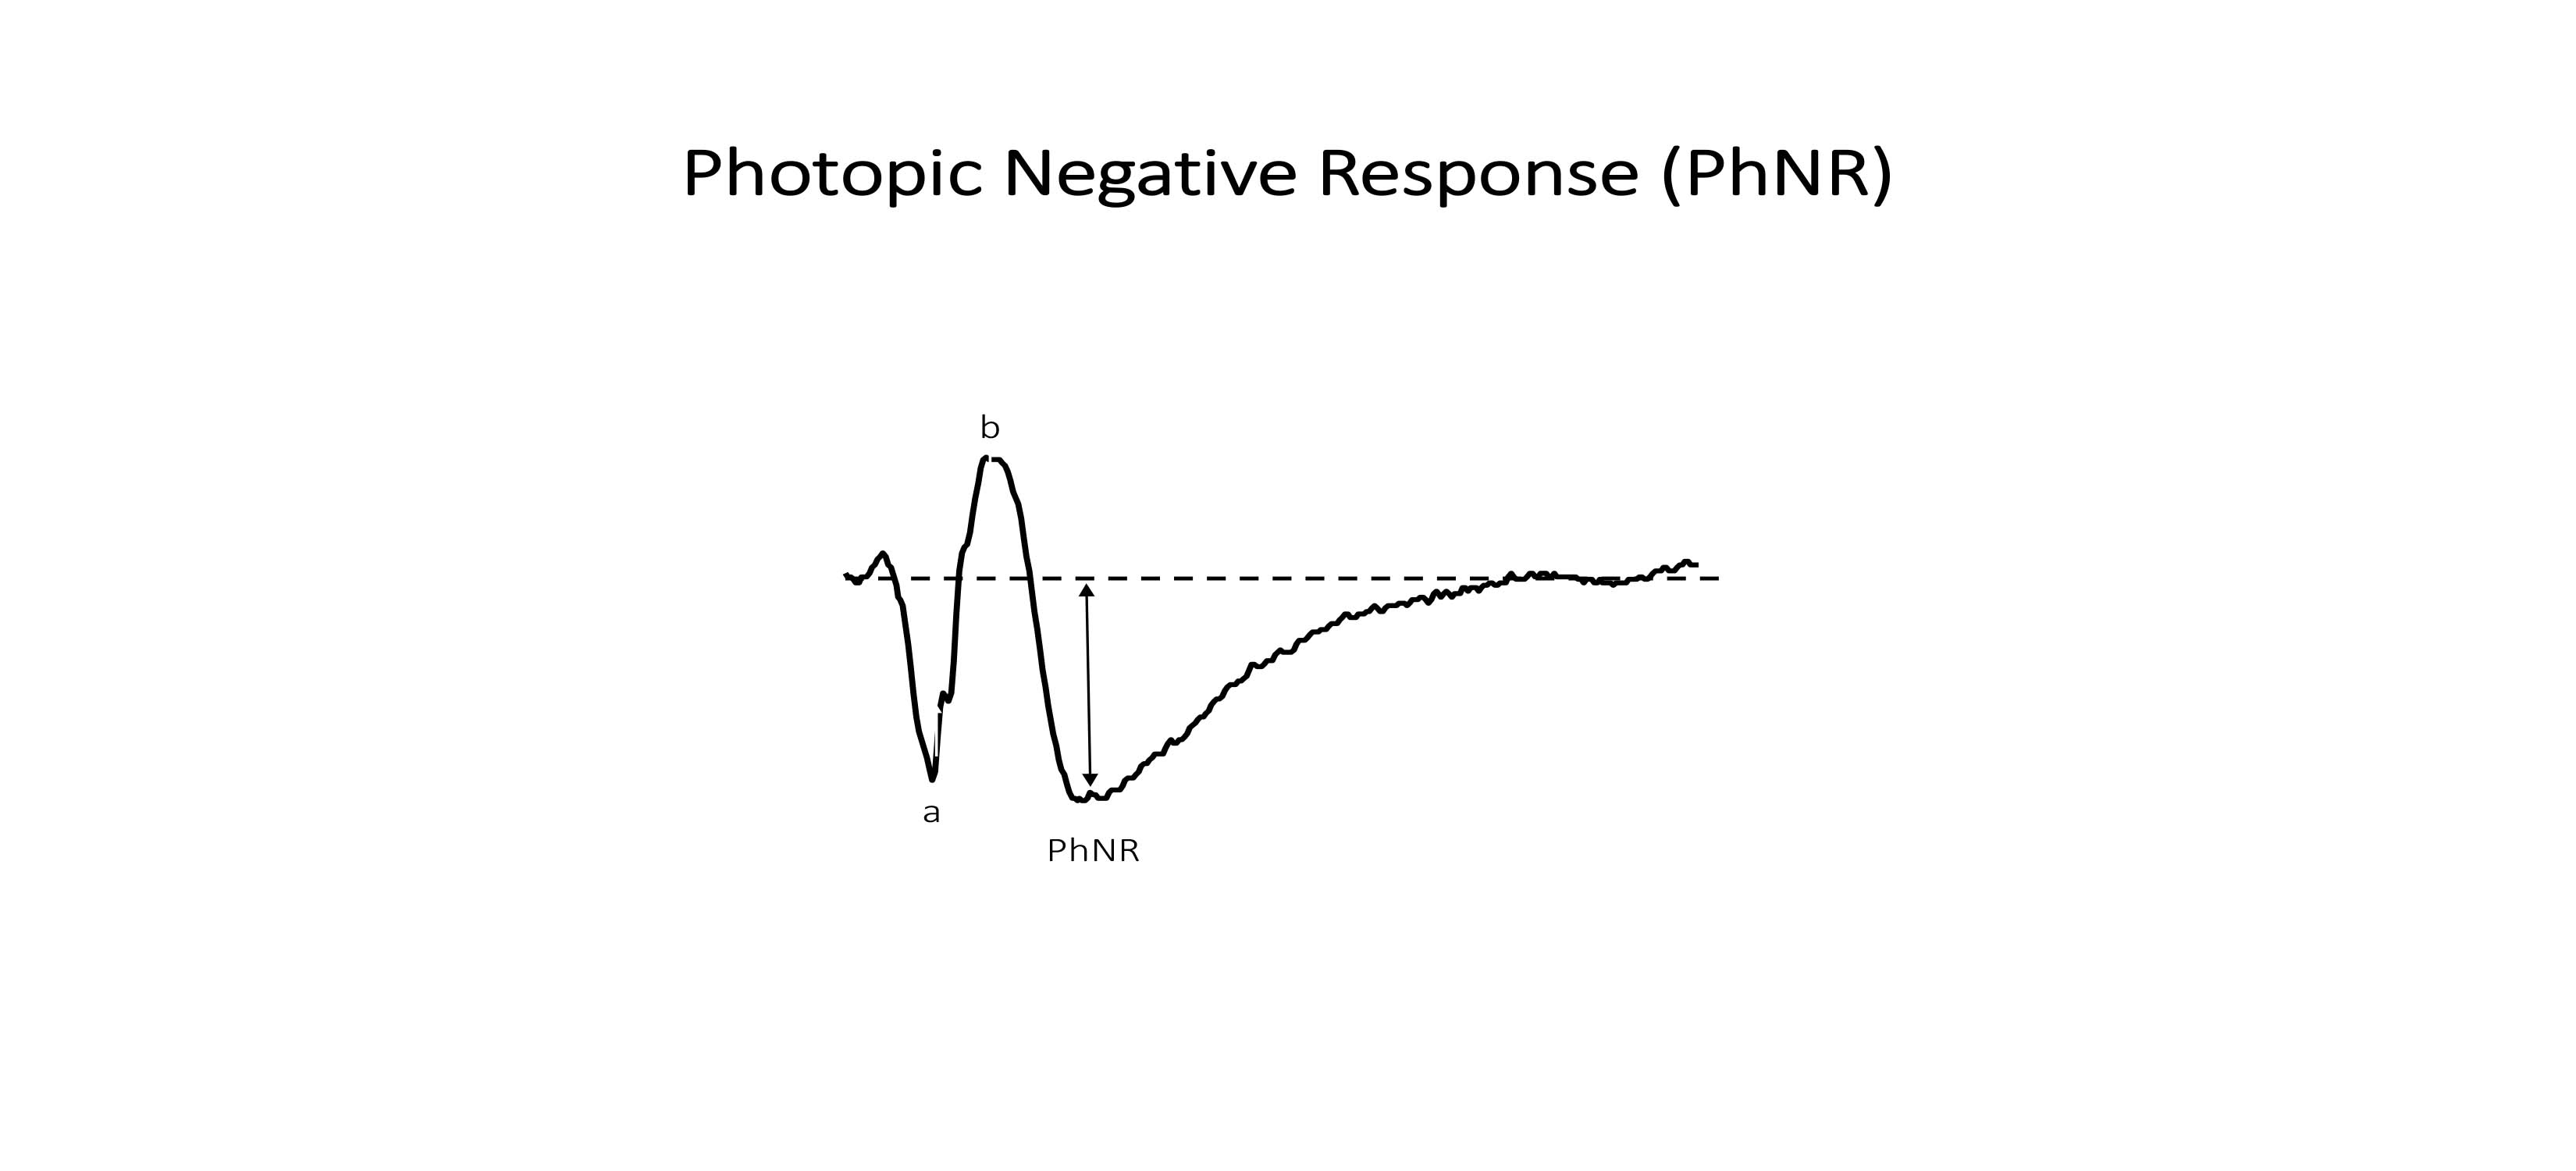
Photopic negative response
The photopic negative response (PhNR) is the light-adapted, negative deflection that follows the b-wave. It originates from the retinal ganglion cells in response to a brief flash.[6][7][8][9][10]
Waveform Analysis (Figure 1)
Amplitude
The amplitude is the maximal light-induced electrical response (voltage) generated by the various retinal cells. The a-wave amplitude is measured from the baseline of the ERG to the negative trough of the a-wave, and the b-wave amplitude is measured from the trough of the a-wave to the subsequent b-wave peak. The PhNR amplitude is measured from the baseline of the ERG to the negative trough of the PhNR.
Implicit time
Implicit time (time-to-peak) refers to the time needed for the electrical response to reach maximum amplitude. Implicit time is from the stimulus onset to the peak of the corresponding wave-component and reflects the rate at which an electrical signal is conducted.
Latency
Latency is the time from stimulus onset to response onset, as opposed to the peak of the response (i.e., implicit time).
The b-wave to a-wave ratio
The ratio of the b- to a-wave amplitudes provides an index of inner to outer retinal function.[2]
Protocols
ISCEV defines 6 protocols to isolate the rod and cone visual systems. These standards are named according to the dark-(DA) or light-adapted (LA) state of the retina and the stimulus flash strength (cd*s/m2).[4]
DA 0.01 cd*s/m2 ERG—rod system (scotopic) response (Figure 2)
a-wave: rods
b-wave: bipolar cells
DA 3.0 cd*s/m2 ERG—rod and cone System (mesopic) response (Figure 2)
a-wave: rods and cones
b-wave: bipolar cells
DA 10 cd*s/m2 ERG—enhanced rod and cone system (mesopic) response
a-wave: rods and cones
b-wave: bipolar cells
DA oscillatory potentials—amacrine cell response (Figure 4)
b-wave: Predominantly inner retinal amacrine cells as well as some vascular function
LA 3.0 cd*s/m2 ERG—cone system response (Figure 3)
a-wave: cones
b-wave: bipolar cells
LA 30 Hz flicker ERG—cone system response (Figure 3)
a-wave: cones
Extended Protocol
PhNR—ganglion cells and inner retinal function (Figure 4)
PhNR's can be evoked using a red LED flash on a steady, blue LED background. The red flash may minimize spectral effects that would otherwise inhibit ganglion cell activity, while the blue background suppresses rods and minimizes light adaptation of cones. Blue stimuli on a yellow background is an alternative approach for similarly minimizing spectral antagonism. Optimal recording conditions for eliciting the PhNR occur at flash intensities of 1.0 to 2.5 cd*s/m2 at a frequency of 1 Hz.[6][11]
Complications
The ffERG is a non-invasive test with minimal risks. Patients may experience mild ocular discomfort during the procedure or, in very rare cases, develop a corneal abrasion depending on the type of electrode used.
Interfering Factors
- Deviating from standardized testing conditions (i.e., lighting, flash intensity, recording environment, duration of light or dark adaptation, and pupil size)
- Electrode-based artifacts including poor contact with skin or cornea, incorrect placement, unstable position, and high electrical impedance
- Eye movement or blinking
- Uncorrected refractive errors
- Reduced electrical response with aging
- Ocular media opacification
- Diurnal fluctuation
- Response depression with anesthesia
- Variability in recordings between different device types[4]
Clinical Significance
The ffERG is proportional to the total area of the functioning retina and has important clinical applications in diagnosing retinal disease since electrophysiological abnormalities often occur early and frequently precede structural findings on retinal imaging.[3]
Cone Dystrophy
Cone dystrophies are inherited diseases mainly of the cones. The ffERG characteristically shows a dark-adapted response that has a normal amplitude but prolonged in implicit time. In contrast, the light-adapted flash and 30 Hz flicker responses are reduced or absent. A classic example of cone dystrophy is achromatopsia.
Cone-rod Dystrophy
Cone-rod dystrophy, also known as progressive cone dystrophy, presents with cone dysfunction in early disease stages followed by rod dysfunction in later disease stages. Therefore, early disease will show reduced or absent light-adapted flash, and 30 Hz flicker responses, whereas later disease will also be accompanied by a diminished or absent dark-adapted response.
Rod Dystrophy
Rod dystrophies are congenital diseases primarily of the rods. ERG testing shows a depressed or an absent dark-adapted response. Examples of rod dystrophy include subtypes of congenital stationary night blindness, namely fundus albipunctatus and Oguchi disease.
Vitamin A Deficiency
Vitamin A is an important component of rhodopsin, a photosensitive pigment important for rod function. Patients with deficient levels of vitamin A, whether from malnutrition, malabsorption, or impaired liver metabolism, experience night blindness secondary to rod dysfunction, and the ffERG shows a depressed dark-adapted response.
Rod-cone Dystrophy
Rod-cone dystrophy presents with rod dysfunction in early disease stages followed by cone dysfunction in later disease stages. The dark-adapted ERG (rod response) is diminished or absent, while the a- and b-waves are delayed and reduced or absent in dark-adapted response to a bright flash (mixed rod and cone response) given poor phototransduction.[12] The later stages of the disease involve abnormal cone function and show decreased amplitude and increased implicit time in the light-adapted flash and 30 Hz flicker cone responses. Oscillatory potentials are also reduced in rod-cone dystrophy. The most commonly inherited rod-cone dystrophy is retinitis pigmentosa.[10]
Retinal Vascular Disease
Central retinal artery or vein occlusion: Vascular occlusions resulting in ischemic damage of the inner retina. The ffERG shows b-wave depression in the dark-adapted ffERG and prolongation of the light-adapted 30 Hz flicker implicit time.
Ophthalmic artery occlusion: Vascular occlusion resulting in ischemic damage of both the inner and outer retina. The ffERG often shows absent a- and b-waves with no recordable response.
Inner Retinal Diseases
Optic neuropathies such as glaucoma, Leber' Hereditary Optic Neuropathy, and papilledema have been shown to decrease the PhNR, with normal a- and b-waves.[6] The PhNR has also been shown to return to normal with the treatment of papilledema.[13]
Non-organic Vision Loss
A normal ffERG is important when trying to distinguish organic from non-organic vision loss.
Ocular Disease with Normal ffERG
Despite its diagnostic value, the ffERG is not without limitations. The ffERG provides a general measure of retinal function and is useful in detecting widespread retinal dysfunction. However, the ffERG is typically normal for focal retinal diseases, including age-related macular degeneration and Stargardt's disease. Therefore, the ffERG may not reveal small retinal lesions, and further testing with alternative, focal ERG modalities may be warranted.[2]
Enhancing Healthcare Team Outcomes
The retina is a complex, neurosensory structure, and patients with retinal disease often present with non-specific visual symptoms. Therefore, determining the etiology of retinal disease by layer and by region is a frequent diagnostic challenge, and an interprofessional team approach is critical for providing appropriate patient care. Patients with sudden onset vision loss are typically encountered in the emergency department. Nurses are likely the first point of contact, who then triage the patient according to symptom acuity and severity. Given the ambiguity in clinical diagnosis and concern for emergent neurologic conditions, physicians and nursing staff routinely order a costly workup involving a battery of tests, the majority of which return negative. In turn, patients are instructed to follow up with an outpatient ophthalmologist. In most cases, these are comprehensive ophthalmologists, who then perform a standard eye examination, including ocular imaging. Notably, however, these diagnostic tests detect structural changes associated with ocular pathology, which do not always correlate with clinical findings. Consequently, patients may be misdiagnosed as having a benign condition and, in some cases, presumed to be malingering. Neuro-ophthalmology is the field that is commonly acknowledged when the etiology of vision impairment remains unknown, despite extensive medical workup.[14] [Level 4] Considering a broad differential is important to distinguish retinal dysfunction from alternative, similar appearing causes since the choice of therapy depends on the underlying etiology of the disease process. Electrophysiology, in combination with other clinical findings, offers invaluable data to assist the members of the interprofessional team and provides effective patient care while minimizing unnecessary tests. Clear communication and care coordination between nurses, physicians, ophthalmologists, as well as ophthalmology subspecialists are critical for establishing a correct diagnosis and proceeding with proper management thereafter. [Level V]