Introduction
The lungs play an essential role in stabilizing the biochemical environment necessary to preserve vital metabolic processes. They directly participate in the regulation and maintenance of acid-base status through oxygen transport and carbon dioxide excretion. The lungs are controlled by medullary centers in the brain which activate or inhibit the contraction of respiratory muscles. These are guided by chemoreceptors, both peripherally and centrally, which sense changes in hydrogen ions (H+) and cause changes in alveolar ventilation to normalize pH and achieve homeostasis. Although this process is well controlled, it is vulnerable to transient or prolonged external insults including toxins and medications as well as obstructive and restrictive lung processes. These insults may decrease or amplify the effectiveness of the body’s ability to cause changes in alveolar ventilation. The carbon dioxide response curve is a representation of the physiologic response of the arterial content of carbon dioxide (PaCO2) on minute ventilation. Here we will discuss the carbon dioxide response curve and the effects that external forces cause on the curve.
Cellular Level
At the cellular level, Carbon Dioxide (CO2) is produced in the peripheral tissues as a byproduct of aerobic glycolysis to produce adenosine triphosphate (ATP), which serves as energy for the cells. The CO2 is then transported to the lungs via the blood both bound to red blood cells as bicarbonate (HCO3-) and as a dissolved gas. Once the venous blood reaches the lungs, HCO3- is then converted back to CO2 by carbonic anhydrase (CO2 + H2O <--> H2CO3 <--> H+ + HCO3-) in the alveolar capillaries to be excreted by the lungs. When CO2 levels are high, the equation shifts to the right causing an increase in hydrogen ions (H+) which translates to a decreased blood pH. When blood pH falls, this drives both peripheral and central chemoreceptors to increase respiratory drive through bronchodilation and hypoxic vasoconstriction to increase CO2 clearance and improve ventilation and perfusion (V/Q) matching. Peripheral chemoreceptors, located within the carotid and aortic bodies, are able to act immediately within seconds of CO2 rise and central chemoreceptors are able to act within minutes. As CO2 clearance occurs, the equation shifts again to the right, therefore, decreasing H+ and again restoring homeostasis.
Function
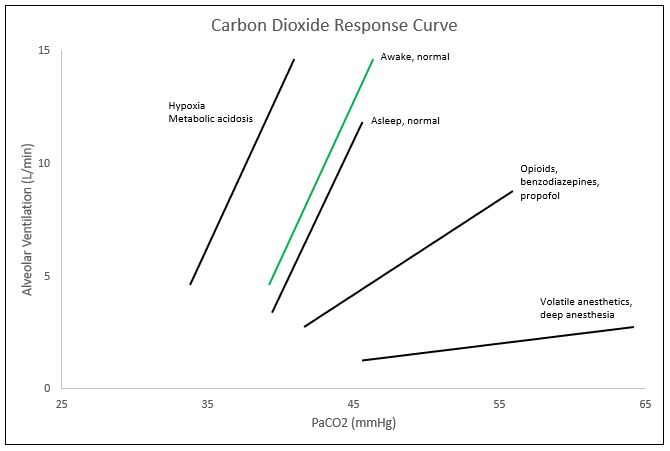
The CO2 response curve is a graphical depiction of the nearly linear relationship between PaCO2 and alveolar ventilation. Though the curve is nearly linear, at the extreme levels of PaCO2 (below 45 mmHg and above 80 mmHg), the linear relationship plateaus. Within the range of 45-80 mmHg for PaCO2, minute ventilation typically increases by 2-5L/min for every 1 mmHg of CO2 increase; though this may vary immensely between individuals. These ventilatory responses can be altered by transient or prolonged external insults including toxins and medications as well as physiologic conditions including age. One major cause of the shift of the CO2 response curve is caused by changes in oxygen saturations. In the setting of hypoxemia, or decreased oxygen levels, the curve shifts to the left, meaning that the alveolar ventilation or minute ventilation in these patients is the same at lower levels of PaCO2. The curve also shifts to the left with metabolic acidemia and central etiologies. Right shifts of the curve, or the same minute ventilation in response to higher levels of PaCO2, are caused by opioids. Benzodiazepines and propofol tend to decrease the slope of the CO2 response curve, and inhaled anesthetics decrease the slope and cause a right shift of the curve. Other changes to the curve can occur with increases in age, as age tends to decrease the ventilatory response to CO2 and an increased level of fitness also tends to decrease hypercapnic respiratory drive.
Mechanism
To monitor changes in [H+] and influence the respiratory response, the body possesses two groups of chemoreceptors: 1) central, H+ receptors in the ventrolateral medulla, and 2) peripheral, PaO2, and H+ receptors located in the carotid and aortic bodies.[1] The central chemoreceptors respond to alterations in [H+] and indirectly tp Co2. Though H+ is unable to diffuse across the blood-brain barrier, increases in CO2 allow diffusion across and which is then converted back to H+ through the carbonic anhydrase. This causes a decrease in the pH of the cerebrospinal fluid (CSF), which stimulates the central chemoreceptor. Peripheral chemoreceptors are most sensitive to changes in PaO2, with some influence from [H+].
In the event of hypoxia, the carotid body response dominates, serving as the primary oxygen sensor.[2] The aortic bodies can also detect changes in oxygen, however, they play a more relevant role in the detection of alterations in blood pressure.[2]
In scenarios in which the receptors disagree, such as hypoxic hypocapnia, the peripheral chemoreceptor hypoxic response dominates, stimulating the respiratory drive to improve oxygenation despite further decreases in CO2.[1] During hypercapnia and acutely increased [H+], the peripheral and central chemoreceptors will simultaneously respond by significantly stimulating alveolar ventilation, inducing respiratory alkalosis, shifting the acid/base status towards neutral. These respiratory changes occur rapidly, while the renal system takes hours to days to adequately respond to metabolic acid/base disturbances through bicarbonate reabsorption and excretion of titratable acids.
The kidneys and lungs function in tandem, with their abilities to correct derangements strongest when compensating against the other system. For example, with metabolic acidemia, the kidneys are unable to properly restore acid/base status, and thus rely on the lungs for compensatory respiratory alkalosis through stimulation of the peripheral and central chemoreceptors in response to hydrogen ion increases.
Clinical Significance
In the setting of clinical anesthesia, the carbon dioxide response curve is subject to drastic changes ranging from changes in threshold (left/right shifts) or sensitivity (slope amplification/depression) pending the agents utilized throughout the procedure, ventilation settings, and current health status of the patient, among others (see Figure). In the event of hypoxemia with PaO2 less than 60 mmHg, the CO2 response curve left-shifts, amplifying respiratory drive.[3] Volatile anesthetics such as des/iso/sevoflurane cause a dose-dependent reduction in the slope of the carbon dioxide response curve, limiting the hypercapnic drive.[4]
Commonly utilized analgesic medications such as opioids, specifically fentanyl, further dampen the CO2 response curve, causing a right shift (decreased threshold).[5] Suspicions are that propofol and benzodiazepines suppress the carbon dioxide response curve by decreasing the slope (sensitivity). Unfortunately, most of the substances/gases utilized to achieve the depth of sedation necessary for proper amnesia and analgesia concomitantly dampen the carbon dioxide response curve, and thus respiratory drive. Under these influences, mechanical ventilation serves as a necessary intervention to artificially maintain a desirable physiological environment. By allowing medications to fall out of their therapeutic window, reversing neuromuscular blockade, and decreasing mechanical ventilation to allow permissive hypercapnia, the anesthesia provider may directly alter the patient's carbon dioxide response curve to increase respiratory drive at the end of the procedure with the intention of extubating the patient upon returning to spontaneous ventilation. In procedures like bronchoscopy, upper GI endoscopy, and colonoscopy, that utilize conscious sedation, pulse oximetry along with capnography is a necessity. Adequate oxygen saturation is easily maintainable by providing more FiO2, but if the patient is not maintaining proper alveolar ventilation, CO2 levels can rise to dangerous levels leading to bradycardia and potential cardiac arrest. Monitoring capnography throughout these procedures allows the anesthesia provider to observe the patient's ventilatory status and intervene if necessary. The alveolar gas equation can easily explain this concept.[6]