Introduction
Clinical personnel must understand how cardiac physiology is intertwined with other organ systems and how pathophysiology relates to simple gross physiology. Cardiac physiology is one of healthcare's most important aspects of medical knowledge.
The cardiovascular system constantly adapts to maintain homeostasis in the body, specifically to maintain oxygen perfusion of tissues. The heart will adapt via multiple variables such as heart rate, stroke volume, preload, afterload, diastole, and systole. This article defines these terms and extrapolates them into a working model of cardiac physiology.
Issues of Concern
- Basic definitions
- Cardiac cycle
- Cardiac myocyte action potential
- Cardiac pacemaker action potential
- Electrophysiology
- Diastolic and systolic heart failure
- Cardiac defects
- Cardiac valve defects
Cellular Level
The cellular physiology of the heart is complex. It will be broken down into two sections: the action potential, which is unique in the heart to other action potentials in the body, and electrophysiology.
Action Potential
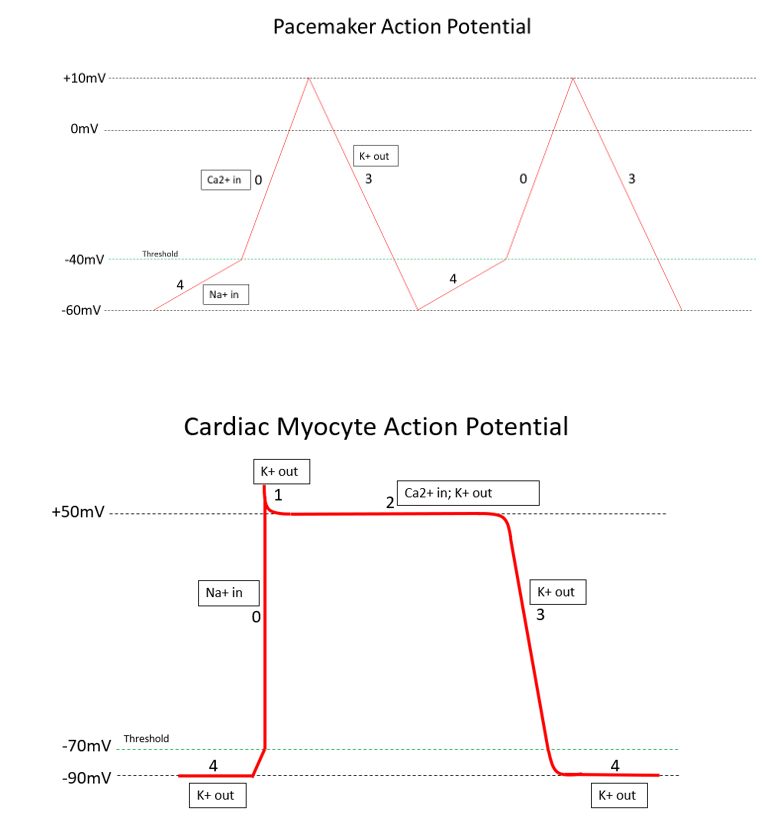
Please see the article image for a visual representation.[1][2]
Cardiac Myocyte
The action potential (AP) in the heart is unique to other action potentials in the body. The action potential has five distinct phases numbered 0-4. The resting potential, or baseline of the AP, is roughly -90 mV and is considered phase 4. Depolarization is the voltage change from the resting potential of -90 mV toward a positive value. Repolarization will be represented by the return of the cell's voltage from a positive value to its resting potential of -90 mV. The ultimate conclusion of a completed AP is the contraction of the cardiac myocyte.
There are multiple types of potassium channels involved in the cardiac myocyte AP. To begin, phase 4 is at resting potential and consists of the first set of open potassium channels, with positively charged potassium flowing out of the cell, keeping the voltage low at approximately -90 mV. This set of potassium channels is passively open and consistently outflows potassium during phase 4.
In the next phase, phase 0, sodium channels open at approximately -70 mV. The initial depolarization from -90 mV to -70 mV is caused by positively charged sodium and calcium ions entering the cell through gap junctions from neighboring cells. These ions depolarize the voltage just enough to open these voltage-gated (VG) sodium channels, further depolarizing the cell to approximately +50 mV. These voltage-gated sodium channels close very quickly upon depolarizing the cell.
Upon reaching peak voltage, voltage-gated potassium channels open and move potassium out of the cell, decreasing voltage again. This is known as phase 1.
In phase 2, the plateau phase, potassium channels open out of the cell, and voltage-gated calcium channels open into the cell. This creates a net charge balance in the cell, creating a plateau.
With phase 3, the voltage-gated calcium channels close, leaving the outward-flowing potassium channels as the only open channels. This causes rapid repolarization, dropping the cell's voltage to -90 mV and closing the currently open potassium channel. At the resting potential, the cell has only the original potassium channel slowly leaking potassium out of the cell, and we are returned to phase 4 of the action potential.
In summary, the 5 phases of the cardiac myocyte are as follows:
- Phase 0: Rapid depolarization from -70 mV to +50 mV; inward VG sodium channels
- Phase 1: Minor repolarization; outward VG potassium channels
- Phase 2: Plateau at +50 mV; outward VG potassium channels and inward VG calcium channels
- Phase 3: Repolarization from +50 mV to -90 mV; outward voltage-gated potassium channels
- Phase 4: Resting potential at -90 mV with minor depolarization from -90 mV to -70 mV; the passive outflow of potassium [3]
Cardiac Pacemaker Cell
The action potential for cardiac pacemaker cells (SA node, AV node, and bundle of His/Purkinje fibers) is unique to the AP of general cardiac myocytes. These cells undergo automaticity and are responsible for the heart rate. Therefore, each AP corresponds to one heartbeat, and the inherent frequency of these cells is essential for maintaining proper rate control.
Additionally, the electrophysiology and anatomy of these pacemaker cells are discussed in a later section. This article will use phases in line with the previous discussion of the cardiac myocyte. To begin, there are three basic phases of the pacemaker AP, but they are named phases 0, 3, and 4, corresponding with the phases of the myocyte action potential. The most significant difference in this AP is that calcium is the driving factor for rapid depolarization.
To start, phase 4 involves sodium influx into the cell. This phase initiates at -60 mV, and the main ion influx is sodium. As the cell gains positive charge due to the influx of positive ions, it reaches -40 mV, which is defined as the threshold for the pacemaker AP. As the voltage hits -40 mV, voltage-gated calcium channels open into the cell to influx more positive ions. This influx of calcium ions denotes the beginning of phase 0, the action potential. The voltage continues to rise until it hits +10 mV, which will shut off the voltage-gated calcium channels and open up voltage-gated potassium efflux channels. The opening of the potassium channels begins phase 3, and the downslope of our voltage will drop back to the start of phase 4 at -60 mV, where the potassium channels will close.
In summary, the 3 phases of the pacemaker action potential are as follows:
- Phase 4: Minor depolarization from -60 mV to -40 mV; passive inflow of sodium
- Phase 0: Rapid depolarization from -40 mV to +10 mV; inflow of VG calcium channels
- Phase 3: Repolarization from +10 mV to -60 mV; outflow of VG potassium channels
Lastly, each pacemaker cell has a different inherent rate at which it can maintain the heart. The SA node is responsible for heart rate under normal conditions; this means that the intrinsic rate of the SA node is typically around 60 to 100 beats per minute (BPM). The AV node is the second pacemaker, which takes over the rate if the SA node begins to fail; the AV node keeps the rate at 40 to 60 BPM. Other foci around the SA and AV nodes (eg, atrial foci and ventricular foci) can contribute to the rate. In pathology such as atrial fibrillation, these foci can even create a disease state through rapid firing, which increases heart rate. However, this discussion is out of the scope of this article.
Electrophysiology
The heart's electrical circuit follows a distinct pathway from the right atrium down throughout the heart's ventricles. The electrical circuit begins at the sinoatrial node, or SA node, located in the right atrium. This node is a unique bundle of cells that undergoes automaticity; these cells have their inherent rate of depolarization independent of other cells in the heart. Following the SA node conduction, the current travels down to the atrioventricular (AV) node. The AV node is located inferior to the SA node in the right atrium in a location known as the Koch triangle on the interatrial septum.[4]
An important distinction regarding the AV node is that it creates a small pause in the electrical circuit. This pause is important because it delays the ventricles from contracting and thus establishes successive contraction of the ventricles following the atria. If this pause did not occur, the atria and ventricles would contract simultaneously, and blood would not flow appropriately through the heart. The current leaves the AV node down a bundle of cells termed the "bundle of His" located inferior to the AV node in the interventricular septum. The bundle of His then transmits the conduction down two bundle branches that arc throughout the two ventricles, named the right and left bundle branches.[5][6]
The right and left bundle branches have many fascicles that divide and supply much of the ventricles. The main continuation of the right and left bundle branch is the Purkinje fiber system, which is a set of many small branches arcing throughout the remaining ventricular space and supplying it with the electrical output.[5][6]
In summary, the order of flow through the electrical system is as follows:
- SA node
- AV node
- Bundle of His
- Right and left bundle branches
- Purkinje fibers
Mechanism
To adequately explain the physiology of the heart, we must first define essential terms. First, diastole and systole. Diastole is the phase of the cardiac cycle that consists of relaxation and filling of the ventricles with blood. Systole is the phase of the cardiac cycle that consists of the contraction of the ventricles and the ejection of the blood. Preload is the volume at which the heart is most filled with blood at the end of diastole; this value is equal to end-diastolic volume (EDV). End Systolic Volume (ESV) is the volume of blood remaining in the ventricles after systole.
Afterload is the pressure the left ventricle must overcome to eject blood into the aorta during systole. Heart rate (HR) is the number of heartbeats per minute, with average values of 60 to 100 beats per minute (BPM). Cardiac output (CO) is HR multiplied by stroke volume (SV); SV is the volume of blood moved out of the left ventricle at the end of systole. SV can be calculated by SV = EDV - ESV, which demonstrates the highest volume of blood in the heart, minus the volume left after contraction, is equal to the volume pumped out into the body.
Lastly, a good illustration of the filling and contraction of the heart is a fireplace bellow. The bellow moves air through its nozzle, but more air is pushed out with a greater spreading of the two handles. The heart is similar in that the preload drives contraction through elasticity and compliance. As the heart expands more with increased filling, it can contract with more force due to its compliance. This demonstrates the importance of preload as a factor in the heart's efficiency. The pathophysiology of this mechanism will be discussed in later sections.
Cardiac Cycle
Blood flow through the cardiovascular system can be divided into two systems: the lungs and the body. The right side of the heart is responsible for taking unoxygenated blood from the body via the inferior vena cava (IVC) and superior vena cava (SVC) and sending it to the lungs via the pulmonary artery to get oxygenated.[7]
The left side of the heart takes oxygenated blood from the lungs via the pulmonary veins and pumps it to tissues throughout the body via the aorta. Because the pulmonary vasculature has a lower blood pressure than the aorta, the right side of the heart has a significantly lower pressure system than the left side of the heart. The concept of pressure physiology will be discussed later in this article; however, the key principle is that for blood to move from one area to the next, it must overcome the pressure in the following area.
Because the left side of the heart must overcome more significant pressure, it is a higher-pressure environment than that of the right side of the heart. As pathology changes the associated systems, the heart will adapt to supply tissues with oxygen adequately. Pressure gradients rule both the left and right systems of the heart. This concept is essential to understanding how the heart functions and how changes in these systems create changes in the heart.[7]
Right Heart
Starting with diastole in the right heart, blood flows freely into the right atrium (RA) from the SVC and IVC. As blood pools in the right atrium, it increases pressure on the tricuspid valve (TV). The key concept of blood flow within the heart is that pressure in one chamber must overcome the pressure in the next chamber to move forward. That is to say, as pressure increases in the right atrium and overcomes the pressure in the right ventricle, the tricuspid valve will open, and the right ventricle will begin to fill.
As blood fills the right ventricle, it now must overcome the pressure on the other side of the closed pulmonary valve; this is a low-pressure circuit. Although the right atrium can overcome the right ventricular pressure with passive filling and contraction in diastole, the right ventricle must use isovolumetric contraction during systole to overcome the pressure from the pulmonary vasculature.
In an isovolumetric contraction, the tricuspid valve closes, and the heart will begin to contract with both the tricuspid valve and the pulmonary valve (PV) closed. As pressure increases during this contraction, it will eventually overcome the pressure from the pulmonary artery, and the pulmonary valve will open, shunting blood to the lungs to get oxygenated.
An example of pathology affecting this circuit would be pulmonary hypertension.[8] Because the lungs create an environment of higher pressure in this scenario, the heart must now contract with more force to overcome this pressure. Over time, the right ventricle will begin to hypertrophy in response to this increased workload. Hypertrophy of the heart can cause a myriad of pathology, including disruption in the electrical circuit, decreased filling capacity, and alteration of heart valves.
Left Heart
The oxygenated blood from the lungs now enters the left atrium via the pulmonary veins. Similar to the right side, the left, now a high-pressure circuit, must overcome pressure gradients. The left atrium will passively fill and contract until it has overcome the pressure in the left ventricle and mitral valve (MV) and will open the valve and begin to fill the left ventricle. Identical to the right side, the left ventricle will fill and undergo isovolumetric contraction during systole to overcome the pressure from the aorta (the body). This pressure is significantly higher than on the right side. As the mitral and aortic valves (AV) are closed, the heart contracts to increase pressure. It will overcome the pressure in the aorta, thus opening the aortic valve and sending oxygenated blood to the body.
An example of pathology affecting this circuit would be systemic hypertension. Similar to the right side, chronic systemic hypertension will increase the pressure of the aorta and cause a response by the heart to increase workload, thus causing hypertrophy of the left ventricle and eventual pathology, as described in the previous example.
As you begin to understand these circuits, it is imperative to include both the heart and where the blood is going. For clinical thinking, the left side of the heart also involves the systemic blood supply, as does the right side of the heart with the pulmonary vasculature. With diseases affecting these circuits, we can now follow the blood flow from one compartment to the next and understand how, for instance, chronic obstructive pulmonary disease (COPD) can create pulmonary hypertension, thus causing an increased workload on the right side of the heart and subsequent pathology.
Pathophysiology
Heart Failure
The pathophysiology of the heart is complex, and as such, several examples will be illustrated to give a basic understanding of the mechanism of changes. To begin, we will discuss heart failure (HF) in the context of two categories: diastolic and systolic heart failure. Heart failure is defined by the inability of the heart to provide oxygenated blood to tissues adequately. The two most important distinctions to make between diastolic heart failure (DHF) and systolic heart failure (SHF) are the ejection fraction (EF) and pathophysiology. Ejection fraction is the fraction of blood moved through the left ventricle (LV) into the aorta over the total amount of blood available in the left heart. The ejection fraction can be calculated as EF = (SV/EDV)*100.[9]
A normal EF is considered greater than 40%; therefore, diastolic heart failure is considered to have an EF greater than 40%, and SHF is EF less than or equal to 40%. The second important factor to keep in mind is that of pathophysiology. For DHF, the key problem is the inadequate filling of the heart with blood during diastole. For SHF, the key issue is inadequate blood ejection during systole. For diagnostic purposes, the most common progression of testing begins with an electrocardiogram (ECG), followed by an echocardiogram, with brain natriuretic peptide (BNP) used to monitor changes in the volume status of the heart. An echocardiogram is considered the gold standard in the diagnosis of heart failure.
Diastolic heart failure is also known as heart failure with preserved ejection fraction. Remember, DHF is considered to have an EF greater than 40%, and our focus is on the lack of filling of the heart. The most common causes of DHF are chronic hypertension, coronary heart disease, diabetes, and obesity. Other rarer causes can include amyloidosis and sarcoidosis, causing restrictive cardiomyopathy. The pathophysiology behind DHF varies, but the leading cause, chronic hypertension, can be explained through hypertrophy of the walls of the heart, resulting in decreased ability to fill the chambers.
In the same way that a biceps muscle would increase in size in response to lifting heavier weights, the heart will hypertrophy in response to a larger pressure in the aorta. As discussed earlier, the left ventricle must overcome the pressure in the aorta to eject blood throughout the body; so, as a patient would present with higher blood pressure over the years, the heart must continue to pump harder to overcome this increased pressure and, over time, will increase in size to adapt.
This increase in size can be visualized through a thickening of the chambers and, consequently, a decrease in the heart's filling capacity. As discussed earlier, preload plays an important role in the ability of the heart to contract, and with decreased filling capacity, thus decreased preload, the heart will be less effective in ejecting the appropriate amount of oxygenated blood, and tissues will begin to lack blood supply.
Systolic heart failure is heart failure with reduced ejection fraction. Remember, SHF is considered to have an EF less than or equal to 40,% and our focus is on the inability to pump blood during systole effectively. The most common causes of SHF are coronary artery disease (CAD), dilated cardiomyopathy (DCM), hypertension, and valvular disease. The pathophysiology of SHF is more straightforward as, for example, a myocardial infarction would directly affect the ability of the heart to contract.
There are other examples, such as aortic stenosis, which can cause a reduced ejection fraction as the heart is required to overcome the stenotic valve and the ejection fraction is lowered. This logic can be applied to most other causes of SHF, where any disease decreasing the contractibility of the heart will directly contribute to a decreased EF. Specifically for dilated cardiomyopathy, there is a myriad of causes that all result in dilation of the chambers of the heart with a decreased ability to contract. Such examples include infections (Coxsackie-B virus), medications (trastuzumab), toxins (ethanol), inflammatory/autoimmune disorders (sarcoidosis), and genetic conditions.
Cardiac Defects
Another significant topic of cardiac pathophysiology is cardiac defects. Many of these defects arise from birth and have significant pathology that alters the heart's structure. The most common cardiac defect is a ventricular septal defect (VSD), an opening in the septum between the ventricles. From birth, this defect causes a shunt from the left side of the heart (higher pressure) to the right side of the heart (lower pressure) and increases the volume load of the right side. This, in turn, increases the pressure load on the right side of the heart and eventually causes hypertrophy of the right ventricle to adapt to this new demand.[10]
An interesting illustration of cardiac physiology related to cardiac defects is Eisenmenger syndrome. In this syndrome, we begin with a VSD and increased volume load on the right side of the heart. Over time, the right side of the heart will hypertrophy, and the pulmonary vasculature will become a higher-pressure circuit in response to the increased volume. As this pressure increases, the right side of the heart will overcome the pressure gradient created by the left side, and the flow through the VSD will reverse, causing a right-to-left shunt instead. This phenomenon demonstrates the adaptability of the heart and the systemic effects that arise from cardiac defects.
Other examples of cardiac defects include atrial septal defects (ASD) and patent foramen ovale (PFO), which resemble VSD but are located in the atrial septum. Similar to the VSD, the pressure gradient will move blood volume from the left atrium to the right atrium and increase the workload of the right side of the heart.[10]
Cardiac Valve Defects
Lastly, we will discuss the pathophysiology of several key cardiac valve defects. One of the most common valve anomalies is aortic stenosis (AS), mainly caused by congenital valvular defects, calcification on the valve, or rheumatic valve disease. With aortic stenosis, the valve does not open fully, and thus, the heart must work harder to eject blood through the ventricle. As the heart continues to increase its workload to overcome the stenotic valve, the left ventricle can hypertrophy and subsequently develop pathologies such as heart failure. The second valvular disorder we will discuss is aortic regurgitation (AR).[11]
The common causes of AR are endocarditis, aortic dissection, and aortic leaflet rupture. In AR, the valves fail to shut completely, thus allowing the backflow of blood at the end of systole. This backflow decreases the total ejection fraction and creates a volume overload state, leading to an increased workload by the left ventricle and eventual left ventricular hypertrophy. With acute AR, stroke volume can decrease, and the heart will begin to adapt accordingly. Our final discussion on valve pathology is of mitral valve prolapse (MVP).
The most common causes of mitral valve prolapse include idiopathic degeneration of the valve, connective tissue disorders such as Marfan syndrome, and genetic causes. The pathophysiology of MVP involves inadequate positioning of the valve leaflets, creating an overlapping, unsupported valve that loses its tension. This pathology causes the valve to prolapse into the left atrium during systole, creating an opening that can cause regurgitation of blood into the left atrium. Although MVP is often asymptomatic, it can create an increased volume load in the left atrium, which the heart will adapt to accordingly.
Clinical Significance
Heart failure symptoms represent two key factors: the inability to adequately oxygenate tissues and the overloading of volume in the heart. With HF, the patient will exhibit fatigue, dyspnea, and exercise intolerance due to the decreased perfusion of essential organs with oxygenated blood. To understand other symptoms of HF, it is important to appreciate the cardiac cycle and how blood flow changes with an overloaded heart.
A helpful way of classifying heart failure to describe symptomatology is right versus left-sided heart failure. Left-sided heart failure, the most common of the two, involves the left side of the heart and is typically caused by chronic hypertension. The left side of the heart pumps blood out to the body; therefore, a higher-pressure environment in the body will cause an increased workload on the left side of the heart and eventual left-sided heart failure. The most common cause of right-sided heart failure is left-sided heart failure, and the mechanism of such is explained below.
Right versus left-sided heart failure pathophysiology involves following the excess blood volume. With left-sided heart failure, the blood will back up and create a volume-overloaded state in the lungs. This increase in volume in the lungs will create a high-pressure environment that can lead to pulmonary hypertension and explain symptoms such as dyspnea. As the lungs continue to increase pressure, the right side of the heart will begin to work harder to overcome this increased pressure gradient. The increased workload of the right ventricle will cause hypertrophy and can lead to right-sided heart failure. With right-sided heart failure, the right heart will become overloaded, and blood will back up into the body through the SVC and IVC, causing symptoms such as peripheral edema, jugular venous distension, and hepatic congestion.