Introduction
The oxyhemoglobin dissociation curve is a vital tool for comprehending how blood transports and releases oxygen. Oxygen is carried throughout the body primarily by a protein molecule, hemoglobin, which is present inside red blood cells. Oxygen can also be carried throughout the body by dissolving in blood plasma, but this dissolved portion only constitutes a small portion of the total amount of oxygen transported in the bloodstream. Only 2% of oxygen in the bloodstream is dissolved directly in the plasma component of blood compared to 98% of oxygen in the protein-bound state to hemoglobin.[1]
It is important to note the difference between oxygen saturation (SaO2)which is the percentage of hemoglobin bound to oxygen and partial pressure of oxygen in the blood (PaO2) which is the amount of oxygen dissolved in the blood. The oxyhemoglobin dissociation curve helps describe the relationship between these two important concepts.
Mechanism
Hemoglobin (Hb) molecule is the combination of protein globin and nonprotein portion called haem and responsible for essentially transporting of the oxygen in the blood. Hemoglobin is composed of four subunits: two alpha subunits and two beta subunits, each of which contains a heme group and globin chain. The heme group contains an iron atom as ferrous form(Fe 2+) at its core that binds one oxygen molecule, allowing one hemoglobin tetramer to bind four oxygen molecules.[2] Hemoglobin exists in two states: the T (deoxygenated-tense) state and the R (oxygenated-relaxed) state. The two states differ in their affinity to bind oxygen. In an unbound state, hemoglobin exists in the T state, and binding of oxygen occurs with low affinity. The T-state hemoglobin thus requires a higher partial pressure of oxygen (pO2) to facilitate the binding of an oxygen molecule. The binding of single oxygen induces a conformational change that destabilizes the T state and facilitates the transition of the other subunits to the high-affinity R state. The binding of the first oxygen allows the second, third, and fourth oxygen molecules to subsequently bind with increasing ease. This relationship is an example of positive cooperativity.[3]
In a set of normal lungs, the partial pressure of oxygen is naturally high at the alveolar-capillary junction. Therefore, exposing the T state hemoglobin to vast amounts of oxygen and facilitating oxygen loading. This process occurs very quickly and allows for hemoglobin to saturate to 100% before the end of the capillary bed.[1] Upon exiting the pulmonic system, the hemoglobin is now in the oxygenated R state. However, the partial pressure of oxygen is naturally lower in peripheral tissue, which aids in the release of oxygen. In the peripheral tissue, the T state of hemoglobin is preferred as there are a lower pO2 and less oxygen bound, which results in a quick release of the other three molecules of oxygen. Throughout the bloodstream, there are different pO2 levels that participate in a continuous equilibrating transition between T and R states.
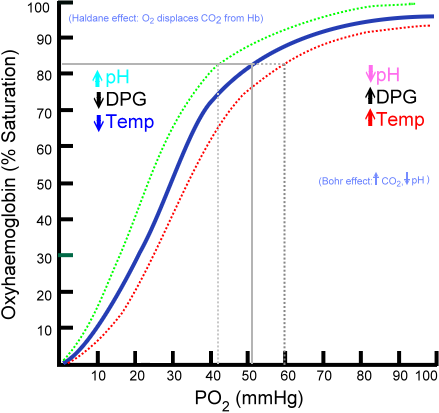
The relationship between pO2 and SaO2 can be represented by the oxygen dissociation curve, which represents oxygen saturation (y-axis) as a function of the partial pressure of oxygen (x-axis). The sigmoid or S-shape of the curve is due to the positive cooperativity of hemoglobin.[4] In the pulmonary capillaries, the partial pressure of oxygen is high allowing more molecules of oxygen to bind hemoglobin until reaching the maximum concentration. At this point, little additional binding occurs and the curve flattens out representing hemoglobin saturation. At the systemic capillaries, pO2 is lower and can result in large amounts of oxygen released by hemoglobin for metabolically active cells, which is represented by a steeper slope of the dissociation curve.
Clinical Significance
The strength by which oxygen binds to hemoglobin is affected by several factors and can be represented as a shift to the left or right in the oxygen dissociation curve. A rightward shift of the curve indicates that hemoglobin has a decreased affinity for oxygen, thus, oxygen actively unloads. A shift to the left indicates increased hemoglobin affinity for oxygen and an increased reluctance to release oxygen. Several physiologic factors are responsible for shifting the curve left or right, such as pH, carbon dioxide (CO2), temperature, and 2,3-Disphosphoglycerate.
pH
A decrease in pH (acidity) shifts the dissociation curve to the right while an increase in pH (alkalinity) shifts the dissociation curve to the left. At greater concentrations of hydrogen ions, hemoglobin stabilizes in the deoxygenated T-state. Therefore, as the pH decreases, and the CO2 increases, the hemoglobin affinity for oxygen will decrease. This inverse relationship is known as the Bohr effect and is evident when metabolically active tissue metabolizes glucose and oxygen into CO2 and organic acids. The hemoglobin then has a reduced affinity to oxygen and helps to deliver it to tissues in need.[5]
Carbon Dioxide
Carbon dioxide affects the curve in two ways: the Bohr effect and through the accumulation of carbamino compounds that are generated by chemical interactions. These compounds form carbaminohemoglobin, which in return stabilizes the T state, lowers affinity for oxygen, and induces oxygen unloading. Only a small portion of carbon dioxide gets transported in this manner. The majority of carbon dioxide is carried in the bicarbonate buffer system. Upon entrance into red blood cells, carbon dioxide is quickly converted to carbonic acid by the enzyme carbonic anhydrase. Carbonic acid immediately dissociates into bicarbonate and hydrogen ions. As previously stated, an increase in hydrogen ions stabilize the hemoglobin in the T-state and induces oxygen unloading which leads to shifting of the dissociation curve to the right.[6]
2,3 Diphosphoglycerate (DPG)
2,3-Diphosphoglycerate (DPG) is an intermediate product of glycolysis that is produced within the red blood cell that affects hemoglobin’s affinity for oxygen. High concentrations of 2,3-DPG will shift the dissociation curve to the right whereas low concentrations will shift the curve to the left.[1] The relationship of hydrogen ions is inversely proportionate with levels of 2,3 DPG which stating that an elevation of the hydrogen ion concentration in red blood cells will result in decreases in 2,3 DPG and vice versa. This is evident at high altitudes where lower oxygen levels induce hyperventilation, causing pCO2 and hydrogen ions to decrease which leads to leftward shifting of the dissociation curve. This left shift leads to an increase in red blood cell production of 2,3-DPG, which leads to shifting the curve back to the right and establishes an essential mechanism of respiratory compensation.[7]
Temperature
The effect of temperature on the curve is relatively straightforward. Oxygen unloading is favored at higher temperatures which will cause a rightward shift. On the other hand, lower temperatures will cause a leftward shift in the dissociation curve. A notable example of this is exercise, where the temperature of muscle increases secondary to its utilization, thus shifting the curve to the right and allowing oxygen to be more easily unloaded from hemoglobin and deliver to tissues in need.
Carbon Monoxide
Hemoglobin binds carbon monoxide (CO) 200 to 300 times more than with oxygen, resulting in the formation of carboxyhemoglobin and preventing the binding of oxygen to hemoglobin due to the competition of the same binding sites. The binding of one CO molecule to hemoglobin increases the affinity of the other binding spots for oxygen, leading to a left shift in the dissociation curve. This shift prevents oxygen unloading in peripheral tissue and therefore the oxygen concentration of the tissue is much lower than normal. Thus in the presence of carbon monoxide, a person can experience severe tissue hypoxia while maintaining a normal PaO2.[1]. Patients with CO poisoning experience symptoms such as headache, malaise, altered mental status, shortness of breath, seizures, or cherry red lips. A pulse oximeter would usually be normal because the machine is unable to detect carboxyhemoglobin from oxyhemoglobin.
Fetal Hemoglobin
Fetal hemoglobin (HbF) is structurally different than adult hemoglobin because it is composed of two alpha and two gamma chains. The gamma chains of HbF have a reduced affinity for 2,3-DPG, thus allowing HbF to have a higher affinity for oxygen at lower levels of partial pressure and resulting in a leftward shift of the dissociation curve. This state is advantageous in the womb, as the fetus can pull oxygen from maternal circulation with greater ease. At the level of the placenta, 2,3-DPG interacts more readily with adult hemoglobin, inducing oxygen unloading. Whereas, fetal hemoglobin is unaffected by the 2,3-DPG and can bind oxygen easily.[8]