Introduction
The ST segment on an electrocardiogram (ECG) normally represents an electrically neutral area of the complex between ventricular depolarization (QRS complex) and repolarization (T wave). However, it can take on various waveform morphologies that may indicate benign or clinically significant injury or insult to the myocardium. Understanding the differential diagnosis for variations in the ST segment is critical for clinical management as it can influence treatment. This article summarizes ST segment, including how it is defined, measured, and how it varies. This article also examines and summarizes ST-segment morphologies unique to various conditions that present with ST elevation or depression.[1][2][3]
Function
ST Segment
The ST segment encompasses the region between the end of ventricular depolarization and beginning of ventricular repolarization on the ECG. In other words, it corresponds to the area from the end of the QRS complex to the beginning of the T wave. In clinical terms, the ST segment represents the period in which the myocardium maintains contraction to expel blood from the ventricles.[4][5][6]
Physiology
The ST segment corresponds to the plateau phase of the ventricular transmembrane action potential. Normally, there are slow and relatively similar transmembrane voltage changes in the ventricular myocardial cells during this phase. These minimal voltage gradients are similar to those found in the period between the end of ventricular repolarization and the beginning of the next cycle of ventricular depolarization. This near absence of voltage gradient is responsible for the normal isoelectric or practically flat ST segment on the ECG. Thus, any significant change in voltage gradients during the plateau phase of the action potential can result in variations in the ST segment. For example, in the presence of acute myocardial ischemia or infarction, ST-segment changes are a consequence of an injury current. An injury current results from current flowing across a gradient of ischemic and non-ischemic zones. This affects the plateau phase of the ventricular transmembrane action potential and, hence, the ST segment. In cases in which myocardial injury has occurred, if ST elevation is present, leads electrically opposite tend to show reciprocal ST depression.
Junction (J) Point
The junction (J) point is where the QRS complex and ST segment meet. It marks the beginning of the ST segment. Any displacement of the ST segment above or below baseline is often measured at the J point. However, it is not always easy to discern the J point because of various ST-segment morphologies. For instance, diffuse J points can be seen with early repolarization, pericarditis, left ventricular hypertrophy (LVH) with strain, and acute myocardial infarctions (MI). Because it is often difficult to make out the J point and/or the beginning of the T wave, the ST segment is frequently an approximation or evaluated at ST, which is the ST segment at 60 ms after the J point.
Reference Point
The reference point used in determining if the ST segment is elevated or depressed has been an area of dispute. The debate tends to be between using the PQ junction which is the end of the PR segment, or the TP segment. This is because the PQ junction and TP segment may not always be at the same level. While the ventricles depolarize, the atria are repolarizing and can affect the level of the PQ junction. Hence, both the PQ junction and the PR segment cannot be the correct reference point.
The American College of Cardiology/American Heart Association joint guidelines recommend that the PQ junction be used as the reference point. Vectorcardiographic analysis suggests that if the QRS-vector loop ends at the point of origin, then the loop is considered closed and there will be no ST-segment deviation. However, if the QRS-vector loop does not end at the onset of ventricular depolarization, then the loop is considered open and there can be ST-segment deviation. Another fact supporting the use of the PQ junction as the reference is that the TP segment may not always be present. For instance, with sinus tachycardia the P wave may be superimposed on the T wave, resulting in the absence of a TP segment. Thus, the PQ junction (end of the PR segment) seems like the better reference point in evaluating for ST segment deviation.
Clinical Significance
Characterizing the ST Segment
The ST-segment can have multiple morphological variations. However, regardless of condition influencing the ST segment, the ST segment can either become displaced above baseline (ST elevation) or below baseline (ST depression). It is also important to evaluate the waveform of the ST segment. Displacement of the J point can be further characterized as horizontal, upsloping, or downsloping; the latter two can be rapid or slow. For example, ST elevation in leads V and V can be described as rapidly downsloping, and in such cases, it is typically benign. These further characterizations of the ST segment can help differentiate between normal and ischemic conditions. For instance, ST elevation with an upsloping ST segment is generally considered normal, while ST elevation with a horizontal ST segment is more characteristic of myocardial ischemia. Therefore, knowing the distinguishing and unique ST segment morphologies of certain conditions can be extremely helpful clinically.[7][8][9]
The T wave should also be considered when assessing the ST segment. In general, myocardial ischemia is represented by ST depression and symmetric T-wave inversion (TWI), while myocardial injury may be indicated by ST elevation with or without T wave changes. T waves should normally be positive in leads I, II, and V-V, and negative in lead aVR. There are many other aspects to consider when evaluating the T wave that are outside the scope of this manuscript. In the remaining sections, we will focus on variations that can be seen with ST elevation and depression and their causes.
ST Elevation
ST elevation occurs when the J point is displaced above baseline. While ST elevation is thought to be an emergent condition in the acute setting and recognized as a sign of an occlusive thrombus, this is not always the case. There are many conditions that can mimic the ST elevation seen in acute MI and simply represent normal variations. In fact, early repolarization, LVH, ventricular aneurysm, left bundle branch block, and other conduction defects have been shown to be more common causes of ST elevation than acute MIs.
Causes of ST Elevation
There are three common causes of ST elevation. The first is when ST elevation can simply be a normal variant. This often is referred to as early repolarization. In such cases, there tends to be J-point elevation with a normal or rapidly upsloping ST segment. The second common cause is from injury currents secondary to acute ischemia or ventricular dyskinesis. And, the third is a result of injury currents from pericarditis. Keeping these three common causes in mind when evaluating an ECG showing ST elevation can help in avoiding the pitfall of misdiagnosing early repolarization for acute MI. Moreover, it can avoid unnecessary thrombolytic therapy and emergent coronary angiography. It is important to note that it is usually difficult to differentiate between these three common causes in clinical practice and that other conditions can also cause ST elevation.
Fortunately, some EKG clues can help differentiate conditions that mimic ST elevation of MI. As aforementioned, normal ST segment variations can be seen with early repolarization. They can also be seen with LVH and other benign conditions. With LVH, the left ventricle becomes thickened or hypertrophied. Consequently, the ventricular (QRS) depolarization mean vector becomes directed posteriorly, often causing deep S waves and ST elevation in the right precordial leads. The deeper the S wave is, the greater the ST elevation will be in those leads. In other words, a patient with chronic LVH may have very deep S waves and significant ST elevation. It is understandable why LVH can easily be misdiagnosed for a true infarction. Another differentiating feature between these two is the ST segment waveform. LVH alone would likely show ST elevation with a concave morphology, while LVH with concomitant acute MI would likely show ST elevation with a convex morphology. Thus, familiarity with these ST elevation mimics and their characteristic morphologies can be quite useful clinically. Always remember to keep clinical context in mind when interpreting any ECG. Any ST elevation with clinical signs of ischemia should be considered pathologic and managed as so until proven otherwise.
ST Elevation Thresholds
ST elevation in the precordial leads V-V can be considered normal depending if it falls within certain threshold values. These threshold values have been established based on age, gender, and race. In general, ST elevation appears to be more pronounced in young and middle-aged males than in females as well as in blacks more so than in whites. The J-point displacement above baseline is also typically most evident in lead V. Criteria for what is considered normal tends to vary amongst sources. One source has suggested that ST elevation up to about 0.3 mV in white males less than 40 years old and up to about 0.25 mV in white males 40 years old and older was considered within normal limits. And, for all white females, it considered ST elevation up to about 0.15 mV within normal limits.
Another source reported the normal limits of the J point and ST. For white and black males, ST elevation in lead V of 0.15 mV and 0.20 mV, respectively, were considered the upper limits of normal. The corresponding upper limit values for white and black females were 0.10 and mV and 0.15 mV, respectively. With regards to upper limits for the ST in lead V, they were 0.30 mV and 0.35 mV for white and black males, respectively; and, for white and black females they were 0.20 and 0.25 mV, respectively.
When evaluating ST elevation clinically, there are threshold limits that have been generally accepted. A threshold value of 0.25 mV for males less than 40 years old should be considered significant ST elevation in leads V and V. For males 40 years old and older, this value is 0.2 mV. For adult females, the value is 0.15 mV. The upper limit of normal J-point elevation in all the other standard leads for males and females is 0.1 mV.
ST Depression and Thresholds
ST depression occurs when the J point is displaced below baseline. Just like ST elevation, not all ST depression represents myocardial ischemia or an emergent condition. There are multiple conditions associated with ST depression. Some of these include hypokalemia, cardiac ischemia, and medications such as digitalis. T wave changes can also occur with ST depression. Concomitant T waves changes can be seen with ventricular conduction abnormalities and repolarization abnormalities as seen with left bundle branch blocks and LVH. Similar to the thresholds set for clinically significant J-point elevation, there are recommended threshold values for J-point depression. For both males and females the J-point depression threshold values are -0.05 mV in leads V and V and -0.1 mV in all other leads. These values can be used in cases of acute myocardial injury when evaluating for reciprocal ST depression.
Conclusion
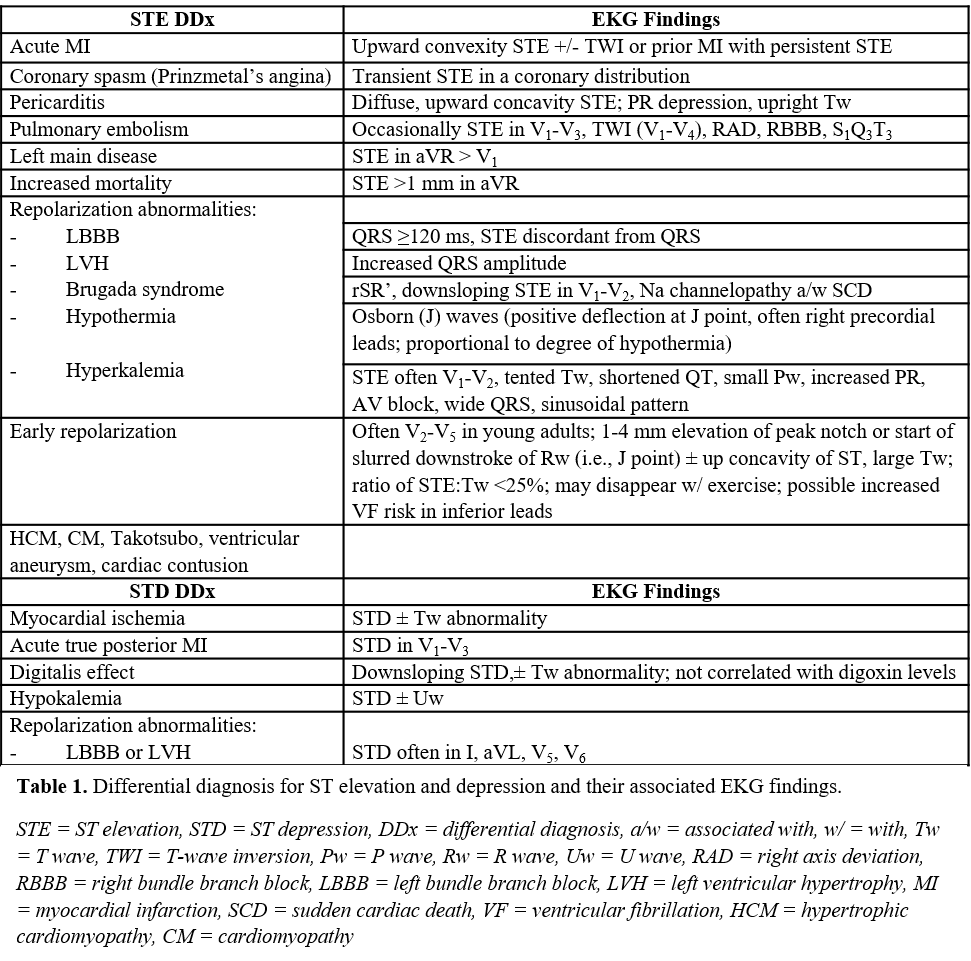
The ST segment represents an important feature of the ECG complex. It can show characteristic features that can help differentiate certain conditions. Table 1 summarizes the differential diagnosis for both ST elevation and depression as well as unique ST-segment morphologies and associated ECG findings that may be seen with each. Being familiar with these characteristic findings along with other ECG and clinical features can aid in accurate diagnosis, management, and treatment.[10]