Issues of Concern
Understanding CT image generation entails an understanding of both hardware and software. Therefore, hardware elements are discussed first.
CT Scanner Components
CT scanners create images using a series of X-rays generated by a tube that is rapidly rotated around the examined object. X-rays are a type of electromagnetic energy that have properties of both particles and waves and a level of energy between ultraviolet rays and gamma-rays in the electromagnetic spectrum. CT scanning hardware consists of the following units:
- The generator
- The scanning unit (gantry), which includes one or more
- X-ray tubes
- Photon detectors
- Shielding elements
- The patient table
- The image processor
- The console (control unit)
Generator
The generator provides the electrical power that is necessary to generate x-rays using two types of electrical current. A high voltage (20-150 kiloVolts) supply determines the maximum intensity of the X-rays that can be produced. Increasing this voltage increases the electrical potential difference between the anode and cathode. A low fixed voltage (about 10 kiloVolts) supply to the cathode filament enables continuous electron emission through a thermionic reaction, which is discussed below.[3]
Scanning Unit (gantry)
A scanning unit, also known as a gantry, is the structure that contains the X-ray tube, shielding elements, and photon detectors. The X-ray tube and photon detectors are positioned to face each other and are built to rotate 360 degrees in one direction around the patient. The gantry tilt is the angle formed between the X-ray tube plane and the vertical plane; in many modern machines, gantry tilt ranges between -25 degrees and +25 degrees. Gantry tilt can be changed by the CT operator according to the exam objectives, such as to reduce image artifacts or improve a healthcare provider's ability to conduct an invasive CT-guided procedure. The use of slip rings in gantries allows continuous complete circular movements of the internal elements without the internal circuits and cables becoming entangled. The gantry contains a space for the table and the patient to pass through. CT was first available for head imaging only, but in 1976 a larger gantry was developed allowing whole-body scans.
X-ray Tube
The X-ray tube converts moving electrons (i.e., electricity) into photons with the energetic properties (the wavelength and amplitude) of X-rays. The X-ray tube is composed of a cathode assembly, an anode assembly, and a rotor, all contained in a tube envelope and together forming a structure called the tube insert. All gas atoms in the space inside the tube envelope have been evacuated, forming a vacuum.[4] Modern CT scanner X-ray tubes usually are provided with 20-60 kiloWatts of electrical power.
The X-ray tube cathode filament (often made of tungsten) expels the electrons that are delivered to it through a process called thermionic emission. The current from the X-ray generator passing through the filament boils off electrons.[5] The emitted electrons are accelerated by the potential difference (i.e., the difference in charge) between the cathode and anode toward the anode (often also made from tungsten). The higher the voltage applied to this process (often 80 to 140 kiloVolts), the more the source accelerates the electrons. When the electrons collide with the focal spot in the anode, they generate electromagnetic radiation having the energy of X-rays via two methods:
- Characteristic X-rays: These occur when an accelerated free-electron strikes the target atom’s nucleus and ejects one of the atom’s inner shell electrons, which escapes the atom as a photon.[6]
- Bremsstrahlung (braking) X -rays: These occur when an accelerated free electron passes through the target atom and has its course deflected by the nearby subatomic particles causing it to lose its kinetic energy. As a function of the first law of thermodynamics, energy is conserved, and the kinetic energy lost by the free electron is gained by other nearby particles, such as an outer shell electron in a cathode’s atom. The loosely bound outer shell electron can then also be emitted as a photon that has the energetic properties (i.e., travels with the wavelength and amplitude) of an X-ray.
The focal spot size can be altered according to the desired image resolution. In general, the smaller the focal size, the higher the image resolution. The process described in X-ray generation converts electric energy into 99% heat and only 1% photons. To absorb this large amount of heat, the space between the tube envelope and the tube housing contains oil for equipment cooling and insulation.
Detectors
The photon detector (also called a photovoltaic cell and more simply termed a detector) absorbs and counts photons generated by the X-ray tube that passes through the patient. The detector consists of two layers; the scintillator layer and the photon tide later. The scintillator layer converts absorbed X-ray photons into visual light photons. The photon tide layer converts the light photons into electrical signals.
First-generation CT scanners contained only 2 detectors, which allowed the generation of two simultaneous views.[7] In second-generation scanners, the number of stationary detectors was increased to 30 detectors arranged in one row covering a 10-degree fan angle. The third generation introduced many more (up to 900) stationary detectors arranged in multiple rows (called multi-row detectors). Multi-row detectors allowed simultaneous scanning of multiple tissue slices simultaneously, which reduced scan time, allowed greater resolution, and improved efficiency in the use of X-ray tube power. Fourth-generation CT scanners contain up to 4500 stationary detectors arranged in a circle around the patient.[8]
X-Ray Shielding Elements
X-rays that do not travel in a straight path from the X-ray tube to the detector that is in line with the beam but instead reach an off-path detector interfere with the machine’s ability to reconstruct an accurate representation of what signal was derived from what original location. This phenomenon, and other types of inaccuracies in image processing, result in image “noise,” which reduces the contrast between imaged structures that is a critical element for maintaining image quality and enabling interpretation of the anatomy and pathology.
As with other types of imaging equipment that use X-rays, CT machines contain collimators, which are materials capable of absorbing the low-energy portion of the X-ray spectrum. These materials both shield (i.e., reduce the overall X-ray exposure of) persons nearby at the time of the scan and reduce scattered radiation, thereby reducing image noise. CT scanners include two types of collimators, the source collimator (also called a diaphragm) and the detector collimator (also called a grid). The diaphragm configures the X-rays produced by the X-ray tube into a beam shape. Despite the formation of a highly focused beam, as the X-ray photons pass through the patient, the patient’s atoms deflect the photons away from their original inline course and scatter them in all directions. The grid absorbs many of the photons traveling off their intended path before they strike offline detectors and can be submitted for image processing, where they will interfere with the measurements obtained from the inline photon beams. The grid also decreases the number of photons needed for image production, thereby indirectly lowering the patient’s total radiation exposure.
Patient Table
The patient's table moves through the gantry during the scan. The distance the table moves during a complete rotation of the gantry is referred to as the table pitch or detector pitch. Table pitch equals the forward table movement in millimeters (mm) during a complete gantry rotation divided by beam collimation (the slice thickness in mm). Faster moving tables are described as having greater pitches. Increased table speed reduces scanning time and radiation but also can reduce image resolution if the circuitry of the machine cannot process the information as quickly as the table moves.[9]
Other Issues Pertaining to CT Machine Hardware
Beam Pitch (BP)
BP is similar to table pitch but is a term used for multidetector CT and factors in the beam width, which is equal to the number of detectors multiplied by the slice thickness in mm. In other words: BP is equal to the forward table movement for each full gantry rotation divided by the beam's width.
Pitch greater than 1 indicates the presence of a gap in the scanned volume, whereas pitch less than 1 indicates overlap of radiated fields in the scanned volume. Setting the pitch to greater than 1 reduces scan time and radiation dose but also reduces image resolution. Reducing the pitch increases the scan time and radiation but also increases the resolution. A low pitch is required to visualize delicate structures or pathological findings (such as arachnoid hemorrhage, small aneurysms, or non-displaced fractures).
CT Systems Generations
As mentioned previously in brief, CT engineers improved the capabilities of machines since the first-generation system developed Hounsfield. Table 1 summarizes the primary features of CT generations.
|
CT System
|
X-ray Tube and Detector Linked Movement/Geometry
|
Detectors
|
Type of X-ray Beam
|
|
First-generation
|
Translate – rotate
|
2 detectors generating 2 simultaneous views along the longitudinal axis of the patient
|
Pencil beam
|
|
Second generation
|
Translate – rotate
|
About 30 detectors are arranged to cover a 10-degree fan angle.
|
Narrow fan beam
|
|
Third generation
|
Rotate – rotate
|
700 - 900 detectors arranged to cover a 45– to a 55-degree fan.
|
Wider Fan beam
|
|
Fourth generation
|
Rotate – fixed
|
1500 – 4500 detectors arranged in a ring that encircles the patient
|
Widest fan beam
|
Table 1. Different generations of CT systems
CT Image Production
Summary of Hardware Functions
The generator produces an electrical current that runs into the X-ray tube and through the cathode wire filament. The current passes its electrons to the filament. The difference in electric charge between the cathode filament and anode across the vacuum draws the electrons toward the anode. Two distinct reactions in the anode convert 1% of the electrons that strike it into X-ray photons. These photons are directed through the scanned patient. The shielding elements help to reduce the scattered radiations and reduce the artifacts in the produced images. The movement of the table through the gantry allows a complete scanning of the desired part of the patient. The degree of X-ray beam absorption (also called attenuation) differs according to the density of each anatomical structure through which the beam passes. The detector receives X-ray photons with different energy intensities and converts them to visual light photons and then to an electrical signal. The electrical signal is conditioned by an electron amplifier and converted from a continuous (analog) signal into discrete (digital) signals by an analog to digital converter.
For each plane of photons detected as having passed through the imaged object, an attenuation profile (projection or shadow image) is recorded by the detector and passed to the image processor. As the X-ray tube and the detector rotate slightly to a second plane, further scanning from the new angle generates a second projection. This process is repeated until the desired portion of the object is scanned in its entirety.
Software Conversion of the Data Into Images
The digital signal is stored as bits and bytes on the processor chip as a permanent, fixed, “original” set of data that contains information about the scanned 3D structure. This data can be manipulated using mathematical algorithms to represent the 3D structure in different ways as different types of images. The mathematics of these manipulations is complex and will be described only briefly in superficial terms. In general, formulas are applied to convert the data from its original reference values (those determined by the process described in the prior section) to new values using a different reference, a process that can be referred to as a “transformation.” When the original byte values representing photon intensity (and scanned object density) are multiplied by a linear coefficient, this process is termed “linear transformation.”
Images are displayed on film or an electric monitor screen. Electric monitor screens are comprised of a matrix divided into squares, which are termed pixels. Each pixel on the screen represents a two-dimensional projection of a three-dimensional volume, which is termed a voxel. Each voxel and pixel is assigned a number reflecting the amount of photon energy absorbed and measured by the detector, which reflects the density of the object that occupied that space at the time of the scan. The larger the assigned number, the greater the brightness of the displayed pixel (and the greater the density of the substance that filled the space in real life).
Hounsfield Units
Tissue physical density is proportional to photon attenuation (photon absorption). The CT detectors measure the degree that the scanned tissues attenuate photons (i.e., their density), and the image processor storing the data as bytes converts these values so that displayed pixels have proportionately assigned pixel brightness. A formula for this calculation to convert byte data into a range of 5000 values is used globally.[10][11]
The scale's range of values is named for Hounsfield; each value on the scale is termed a Hounsfield unit (HU). Densities of various substances have been assigned relative values, which are termed attenuation coefficients. The density of the substances in the patient (both natural tissues and any medical implants) and around the patient are calculated based on a linear transformation of the measured X-ray attenuation coefficients.[12] This transformation is based on the standard density measurement of two substances, distilled water (set as 0 HU) and air (set as -1000 HU) at 0 degrees Celsius temperature and a pressure of 10 Pascals.[13] HU for various scanned tissues are computed from the following equation:
- HU =1000 X (tissue μ – water μ)/ water μ, where μ is the linear attenuation coefficient
CT scanners used in medical practice can present HU within a range of –1024 HU to +3071 HU.[14] Interpretation of clinical images often depends on evaluating a structure's HU, such as differentiating vascular lesions (which are dense when filled with contrast) from non-vascular lesions and distinguishing acute hemorrhage (which is dense) vs. non-acute hemorrhage or other substances. Different publications define different ranges for certain tissues and substances, for example:
- Fat (as in omental and subcutaneous fat) having HU from -40 to -100,
- Soft tissue (such as muscle and tendon) having HU from 40 to 80, and
- Cortical bone (such as in long bones or the cranium) having HU from 400 to 1000.[15]
Additional Factors Pertinent to Viewing CT Images
Image Windowing
Although the HU values in CT images are expressed on a 5000-unit scale, the human eye can distinguish many fewer grey shades in optimal conditions.[16] The displayed greyscale brightness and contrast can be altered by decreasing or increasing the number of included Hounsfield Units (termed the “window”) and/or the Hounsfield Unit value that is set as the central/middle value (termed the “level”). The person viewing the image can manually adjust these settings using a mouse that interacts with the image software. Adjustment of what is visible in the image based on adjusting the visible HU in this manner is referred to as “windowing” or “changing the window.”
The window width determines image contrast. The greater the width, the less the contrast. Window width represents the range of HU included in the image. A narrow window (50-350 HU) is suitable for examining structures of similar attenuation values. A wide window (400-2000 HU) is suitable for examining structures of vastly different attenuation values. For instance, chest structures are best viewed using a wide window, which simultaneously demonstrates low attenuation findings in lungs and high attenuation bone in the thoracic wall.
The window level determines the image brightness. The greater the level, the greater the brightness. Setting the window level determines the central or midpoint grey value for the range of HU displayed in the image. The higher the window level, the greater the image brightness and vice versa. Ideal imaging of different tissues (e.g., the brain versus the subarachnoid space, scalp, or sinuses) also depends on the window level.
Image Reformatting (multiplanar reformation or MPR)
In addition to transverse slices, coronal, sagittal, and other (oblique) slice planes can be reconstructed from the original 3D volume data by MPR.[17][18][19] The transverse (axial) plane is the traditional plane for viewing CT images, at least in part because it enables analysis of symmetry and because anatomic structures that have pertinence to each other (such as the liver, pancreas, gallbladder, and bile ducts) tend to be more congregated and to be most likely to appear simultaneously on an image in the transverse plane. However, other viewing images using planes may be preferential for specific types of evaluation. For example, the sagittal plane is ideal for imaging midline and other longitudinal structures, such as the spine, uterus, and pituitary gland. The coronal plane is ideal when evaluating symmetry is important for viewing longitudinally oriented structures, such as long bones, the lungs, and certain cerebral gyri. Some hospitals do not use MPR on all CTs in order to save money on data storage. However, MPR allows:
- Better visualization of the musculoskeletal system to assess fracture configuration and the cartilage, ligaments, tendons that stabilize joints that take oblique courses.[17]
- Better visualization of curvilinear structures like the appendix, and
- Better evaluation of whether possible findings are real findings or are image artifacts.
Image Reconstruction/Rendering
The image processor can retrieve and manipulate the stored data for every possible voxel as defined by the imaging software. The number of voxels used to create the image can be altered at will to represent the imaged tissues at differing resolutions; the greater the number of voxels used, the greater the image resolution. A row of voxels that forms a line from one side of the imaged space to the other is termed a linear attenuation profile. The computer’s memory stores a unique linear attenuation profile for each angle from which the examined object was scanned that can be manipulated into a new data set of new attenuation profiles.
In contrast to image reformatting, where the image processor displays the original data set in different planes, image reconstruction refers to when the processor software applies one or more mathematical transformations to convert the linear profiles from the original data set into a new data set. A reconstruction termed simple back-projection sums all the attenuation profiles of the imaged object together. This process usually results in a blurred image. To sharpen the image, a process called convolution is used that applies a mathematically derived algorithm to filter each attenuation profile prior to the summation. This results in a reconstruction termed a filtered back projection. Filtered back projections of different types are used primarily to emphasize or minimize the contrast between adjacent pixels. Increased sharpness is useful for identifying fractures (particularly non-displaced fractures), but increased sharpness also increases image noise.
Data can also be manipulated (reconstructed) to simulate the 3D appearance of structures. This process can be used to emphasize the structure’s surface (called surface rendering) or its whole shape (called 3D rendering). In these techniques, the software uses a mathematical algorithm that manipulates the voxel values for each attenuation profile to display pixel values that differ from those used to display standard 2D images.
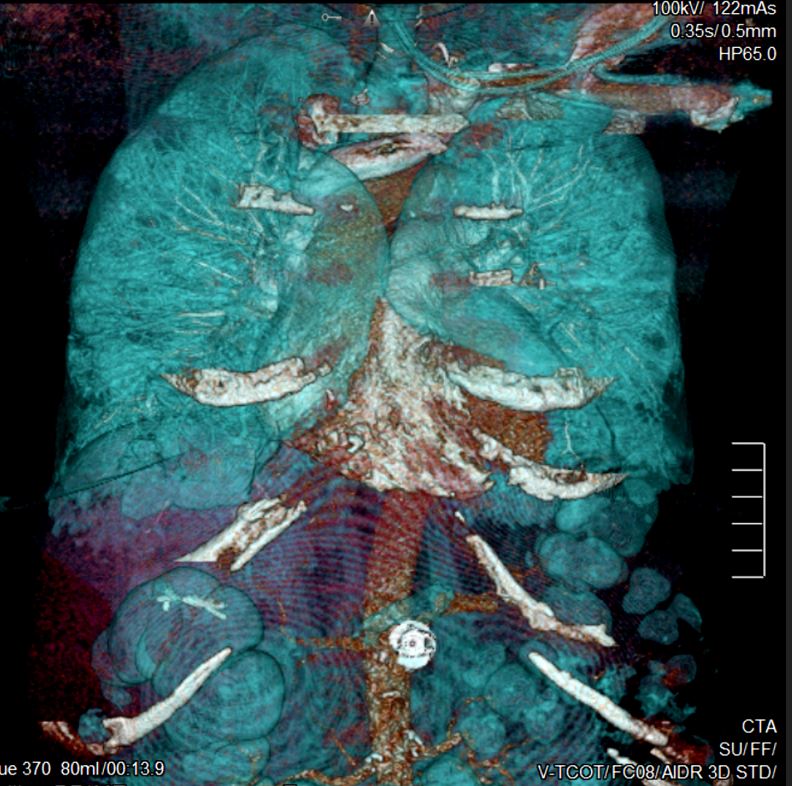
Volume rendering technique (VRT) uses an algorithm for assigning a final value to a voxel. First, it assigns each voxel a weighted score depending on its opacity (i.e., it weights voxels having certain opacities more than it weights other voxels with other opacities). Second, it multiplies each voxel by a factor determined from the summed voxel values. Lastly, it sums the values from the first two calculations to achieve a final displayed voxel value. VRT is not limited to a value of maximum density; the entire Hounsfield scale could be included. However, certain types of VRT intentionally limit these values to highlight certain tissues or structures. Image reconstruction techniques include 3D volume rendering, shaded surface display, maximum intensity projection, minimum intensity projection.
- 3D Volume Rendering (3DVR) (see figure below) 3DVR attempts to make structures appear fully 3D. This technique is useful when evaluating.
- Structure sizes, such as aneurysm size or artery hypoplasia
- Complex morphologies, such as comminuted fractures
- The relationship between two structures, such as a metastatic bone tumor enveloping a nearby artery
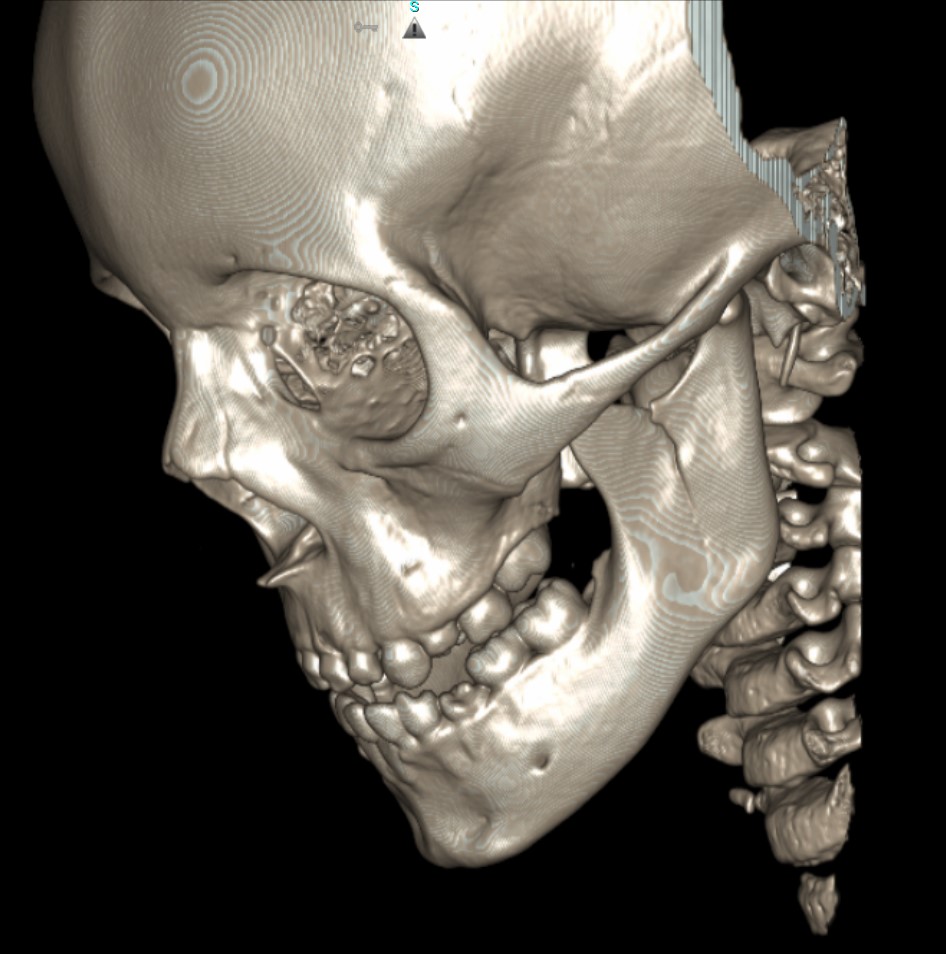
- Shaded Surface Display (SSD) (see figure below) SSD, also known as surface rendering, selects voxels to display based on a selected range of HU. SSD includes or excludes voxels from the image based on algorithms set to detect differences in density at the edge of structures where surfaces have different densities.
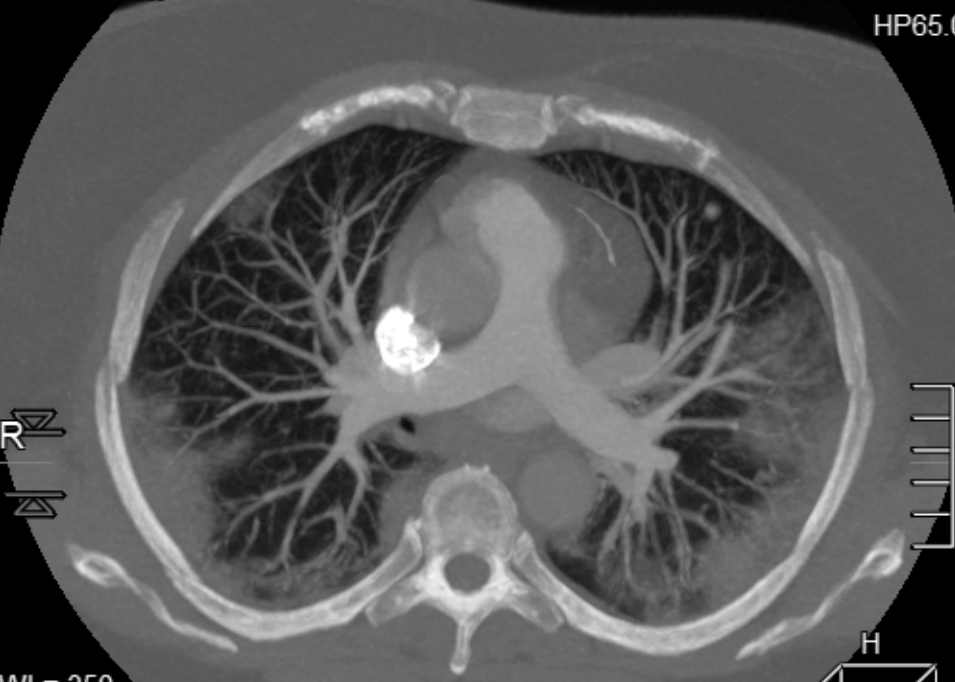
- Maximum Intensity Projection (MIP or MaxIP) (see figure below) MIP displays voxels with the highest density (HU) on every view through the 3D image volume.[20] MIPs better display high-density structures, such as bone and contrast-filled arteries, than SSD.[21] MIPs are frequently used for CT arteriography, such as for detecting emboli in the pulmonary arteries.
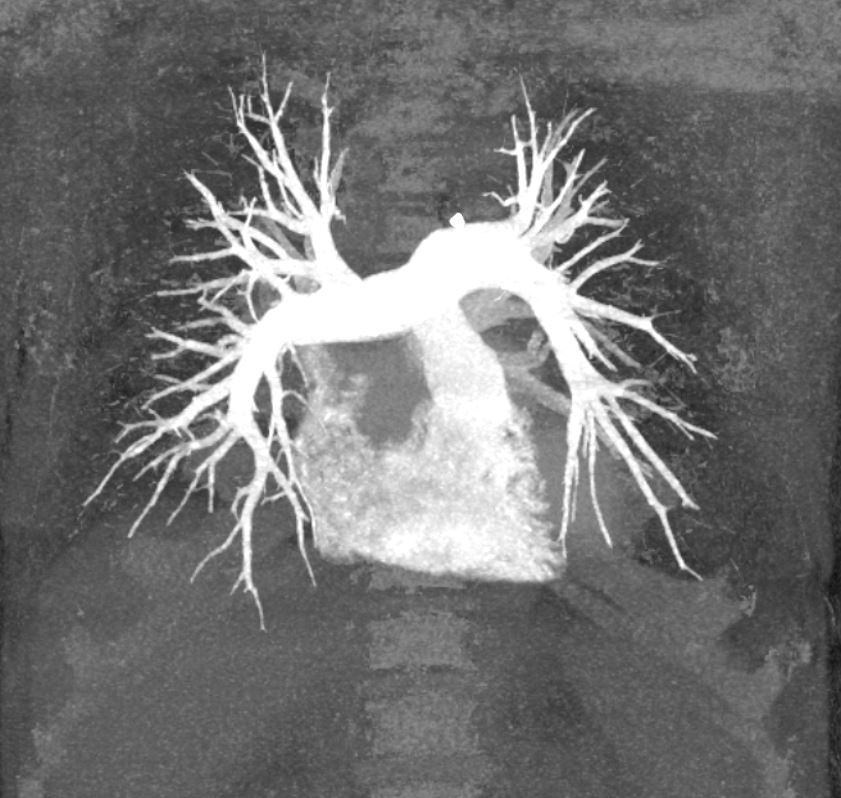
- Minimum Intensity Projection (MinIP) (see figure below) MinIP displays voxels with the lowest density. MinIP is suitable to highlight air-filled structures, such as the bronchial tree.
- Sliding-Thin-Slab Reconstruction (STS Reconstruction) (see figure below) STS reconstruction combines thin cut slices with slices of various greater thicknesses to preserve visibility of low-contrast features. STS helps display structures that extend across several slices, such as blood vessels, ligaments, and tendons.
CT Contrast Media Iodine-containing contrast media can be used to improve the contrast of soft tissues on CT images, which is particularly important for identifying structures based on their vascular supply and for situations involving the assessment of tumors and infections. IV contrast media used in clinical practice can be categorized as:
- Ionic monomers, e.g., diatrizoate,
- Non-ionic monomers, e.g., iopamidol,
- Ionic dimers, e.g., ioxaglate, and
- Nonionic dimers, e.g., iotrolan.
Following intravenous injection, contrast material crosses from capillaries to the extracellular spaces is redistributed back into the capillaries and systemic veins and is excreted by the kidneys. Persons with healthy glomeruli can filter all IV contrast into the urine within 12 hours. The amount of required contrast material depends on multiple factors, particularly the patient's body mass. Typically, 1 to 2 ml of contrast is injected per kg of body mass. When injected into an upper extremity vein, the time at which the contrast bolus peaks in the systemic arteries is about 20 seconds, followed by a systemic venous peak at about 70 seconds. Scans through the anatomical areas of interest are timed based on the type of information desired.
Each scan through the same anatomy is called an image phase. Nearly all scans that use IV contrast include a systemic venous phase. For example, imaging of the liver most commonly includes one phase (scan) that highlights the flow of blood through the portal vein, which peaks between the arterial and systemic venous phases. Imaging specifically for liver tumors involves a non-contrast scan, an arterial phase, or portal venous phase, and sometimes a delayed phase. Scans designed to evaluate systemic arteries use an arterial phase and are referred to as CT arteriograms (CTA).
Contrast can also be administered by routes other than IV. Oral contrast material, such as barium sulfate and Gastrograffin, is commonly used to expand the gastrointestinal tract lumen and improve the contrast between it and the intestinal mucosa.