Introduction
In 1937, Tiselius, a biochemist from Sweden, demonstrated that particles with charge could be separated based on their charge with the help of an electrical field. Various biomolecules, such as proteins, peptides, nucleic acids, nucleotides, etc., also possess electrical charges. In electrical field applications, they migrate towards anode or cathode based on their net charge. Electrophoresis is the migration of electrically charged molecules under the effect of the electrical field.[1]
Tiselius used a liquid medium that had less resolution due to the effect of gravity and diffusion. Electrophoresis utilizes solid support media with buffers to overcome these obstacles. Molecules with similar charge, mass, shape, and size tend to move together and are separated into distinct bands or zones. Whatman filter paper, agarose, cellulose acetate, polyacrylamide, etc., are examples of such solid support mediums.[1]
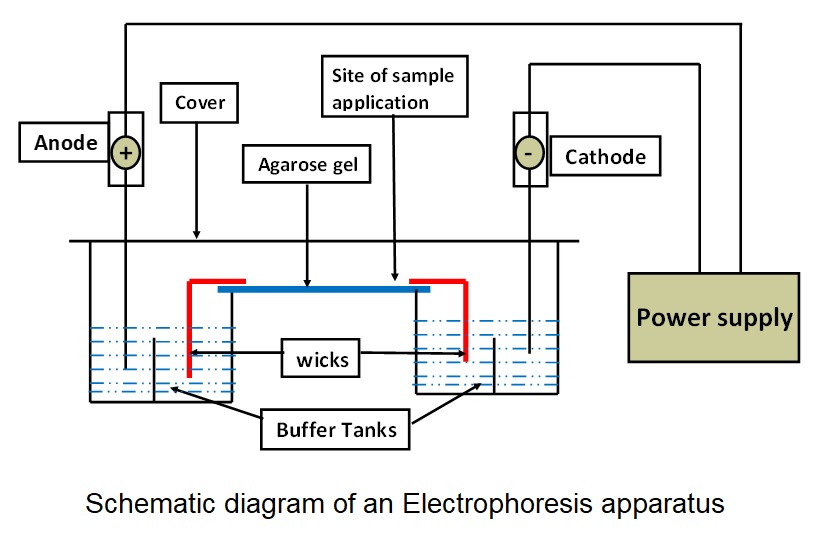
General components of electrophoresis apparatus: Schematic diagram of an electrophoresis apparatus (see Image. Hemoglobin Electrophoresis Patterns).
Functions of Each Component of the Electrophoresis Apparatus
- Buffer: Carries the current and maintains the pH of the medium.
- Wicks: Connects support medium with buffer to complete the circuit.
- Support medium: Provide the matrix in which separation takes place.
- Cover: Reduces evaporation of buffer and prevents contamination during the electrophoretic run.
- Power supply: Provides an electrical field for the movement of charged particles.
- Densitometer: Quantification of separated bands is done by comparison of the optical density of bands.
Factors Affecting Electrophoretic Mobility of a Molecule
Size, shape, and net charge of the molecule
- Mobility is inversely proportional to the size of the molecule and directly proportional to the net charge of the molecule. Globular proteins have compact structures and faster mobility than fibrous proteins of similar molecular weight.[2]
- Particles with a negative charge (anions) always move in the direction of the positive pole, whereas particles with a positive charge (cations) always move in the direction of the negative pole. When performing gel electrophoresis, the positive pole refers to the anode, while the negative pole refers to the cathode. As a result, charged particles move to the nodes that are appropriate for them [e.g., anions migrate from cathode (-) to anode (+)].[2]
Strength of the electrical field
- Mobility is proportional to the potential gradient (voltage) and inversely proportional to resistance.
Buffer
- Buffer functions to carry the current and maintain the pH of the medium. The optimum ionic strength of the buffer is necessary as higher ionic strength increases the share of current carried by buffer ions & slows down the sample migration. It also produces high heat, leading to increased diffusion of separation bands. The low ionic strength of the buffer also reduces resolution due to reduced overall current passing through the medium.
- The ionization of molecules, such as proteins, amino acids, etc., depends on the pH of the medium. Alteration in the pH of the medium can alter the direction and velocity of migration.[2]
Supporting medium
- A medium having affinity for the molecules in samples can hinder the rate of migration and can decrease the resolution of separation. The pore size in the support medium is inversely proportional to the gel concentration. Adjusting pore size according to the properties of a molecule of interest is necessary for optimum resolution.
- Fixed groups such as sulfate get ionized and acquire a negative charge at alkaline or neutral pH. Applying the electrical field, HO ions associated with these negatively charged groups start migrating toward the cathode. This movement hinders sample movement towards the anode and can reduce separation resolution. This effect is known as electroendosmosis. It can be reduced by using ultrapure agarose gel with low sulfate content.[3]
Types of Support Medium
Different support mediums and buffers are utilized to separate different molecules effectively.
Whatman filter paper: Whatman’s filter paper is a support medium. As it requires long run-time (12-16 hours) and low voltage for separation, the resolution is poor due to the increased diffusion of separated analytes.[4][5]
Cellulose acetate: Cellulose acetate membrane is a preferred solid media as it requires less run-time (<1 hour). Due to this, the resolution of separated bands is far superior to paper electrophoresis. Though expensive, it is widely used for separating lipoproteins, proteins, enzyme isoforms, and hemoglobin variants due to superior resolution and less interaction with analytes in a sample.[5][6]
Agarose gel: Agarose is a type of heteropolysaccharide. It forms a viscous solution when dissolved in a hot buffered solution (50-55 degrees Celsius) but solidifies as a gel on cooling down. It separates serum proteins, hemoglobin, nucleic acids, polymerase chain reaction products, etc. Fixed sulfate groups present in agarose can reduce the resolution of bands due to increased electroendosmosis. This can be prevented by using ultrapure agarose gel with low sulfate content.[5][7]
Polyacrylamide gel: It is formed by polymerization of acrylamide and bis-acrylamide in the presence of ammonium persulfate, N, N, N’N’-tetramethylethylenediamine (TEMED) & riboflavin in the presence of ultraviolet (UV) rays. The pore size of the gel can be very well controlled by adjusting the concentration of monomers. This gel can be used for various analytes such as proteins, peptides, nucleic acid, nucleotides, etc. It can provide excellent resolution due to better molecular sieving and minimal interaction of sample molecules with the matrix.[5][8]
Suppose the protein solution is boiled briefly in sodium dodecyl sulfate (SDS) and mercaptoethanol. In that case, proteins in the solution get denatured, and they acquire a uniform negative charge, which masks the native charge of the protein. This produces polypeptide chains with a constant charge-to-mass ratio with a uniform shape. In this condition, electrophoretic mobility depends on the number of amino acids and the mass of the polypeptide chains.[5][9]
Other Variants of Electrophoresis
Isoelectric focusing (IEF): The gel matrix is filled with ampholytes (positive and negative charge molecules), forming a pH gradient. When the electricity is applied, molecules migrate towards their isoelectric pH. The mobility of sample molecules stops at their respective isoelectric pH, where the net charge on the sample molecule is zero. IEF can provide excellent resolution and fractionation of serum proteins and hemoglobin variants.[5][10]
Immunoelectrophoresis and immunofixation electrophoresis: Initially, proteins are separated on the agarose gel. Wells are created after separation, and specific antibodies against molecules of interest are added. Bands of precipitation due to antigen-antibody reaction are formed, which signifies the presence of a specific protein in the sample. It is used to identify the abnormal elevation of gamma globulin fractions and free light chains in patients with suspected monoclonal or polyclonal gammopathy.[11]
High voltage electrophoresis: Relatively higher voltage (400 to 2000 Volts) is used instead of 250 Volts for separation. It provides high-speed separation with good resolution and relatively less diffusion. It is used for the separation of proteins, hemoglobin, and nucleotides.[5]
Pulse field electrophoresis: Separation of long nucleotide fragments with good resolution is difficult with conventional electrophoresis. In pulse field electrophoresis, the current is passed in 2 different directions alternatively, which leads to the movement of fragments in 2 directions, giving good separation with optimum resolution.[12]
Capillary electrophoresis: A minimal-diameter capillary tube filled with buffer solution, ampholytes, or gel is used as a support medium. Due to the availability of a higher surface area for heat dissipation, very high voltage can be applied for speedy separation and better resolution. Separated fractions can be quantified simultaneously as they pass through the detector during the electrophoretic run.[13]
2-dimensional (2D) electrophoresis: Initially, isoelectric focusing (IEF) is done to separate the analytes based on their isoelectric pH. The gel containing separated analytes is then subjected to SDS-polyacrylamide gel electrophoresis in the direction of 90 degrees to the IEF run. Molecules having similar molecular weight can be separated via this method due to differences in their isoelectric pH.[5][10]
Specimen Requirements and Procedure
Specimen requirements and processing vary depending on the type of electrophoresis and disease involved. Serum, plasma, whole blood, and hemolysate are the most commonly used biological specimens in diagnostic laboratory setups. Nucleic acid or protein extracts from tissue or cellular lysates, products of polymerase chain reaction (PCR), sequencing experiments, etc., are the specimens used in research laboratories working on molecular biology, genomics, and proteomics.[5]
Testing Procedures
Confirmation of sample details with the test requisition form is done. Initial processing of the sample is per procedure requirements.
Serum or plasma can be separated using centrifugation from plain or anti-coagulant-containing vials. Serum and plasma are used to assess and quantify protein fractions to diagnose disorders related to their synthesis or disposal. Hemolysate can be prepared using buffers and whole blood specimens from the anti-coagulant-containing vial. Hemolysate assesses and quantifies hemoglobin fractions to diagnose hemoglobinopathies and thalassemia.[14]
Nucleic acid extracts and PCR products can be used after mixing them with sucrose, buffer, and tracking dye. After setting up the instrumentation and gel, the sample is applied, and the electrical supply is started. When tracking dye completes a run of approximately 80% of the gel, the electrical supply is turned off, and the separation of bands is quantified using densitometry.[14][15]
Interfering Factors
The major interfering factors are heat, non-specific adsorptive groups on the support medium, and electroendosmosis. As the current and duration of electrophoresis increase, the gel's temperature increases due to heat dissipation. This increases the random motion of the molecules in the medium, reducing the sharpness/resolution of the separated bands.
Non-specific adsorptive groups on the support medium lead to the binding of analytes with these groups and hinder their mobility across the gel. As described earlier, electroendosmosis generates ion flow opposite to the direction of the analyte motion, leading to a reduction in resolution.[16]
Results, Reporting, and Critical Findings
After the electrophoresis run, the gel is stained for the analyte of interest. After incubation with the staining solution, excess stain is removed by treating the gel with the de-staining solution.
After staining, the gel is visualized with the suitable wavelength of light, and the optical density of each separated band is quantified by densitometry. The optical density of each separated band is proportional to the concentration of stained analyte present in that band. The report contains the percentage proportion of each stained analyte in the sample. The following table shows stains utilized for various analytes.[17][18]
| Analyte |
Stain |
| Amino acids |
Ninhydrin |
| Proteins |
Ponceau S, Comassie blue 250, Silver stain, Amido black
|
| Lipoproteins |
Sudan black B, Oil red O |
| Glycoproteins |
Periodic Acid-Schiff (PAS) stain |
| Hemoglobin |
Ponceau S, O Dianisidine, ferricyanide |
| Nucleic acid |
Silver stain, Ethidium bromide |
An abnormal electrophoretic pattern of serum or hemoglobin electrophoresis can alert the clinician to emphasize the identification of an abnormal fraction of protein or hemoglobin in the patient’s sample. Critical analysis of electrophoretic patterns can help the clinician diagnose an underlying disorder that led to an abnormal analyte or the absence of a typical analyte in the case scenario.
Clinical Significance
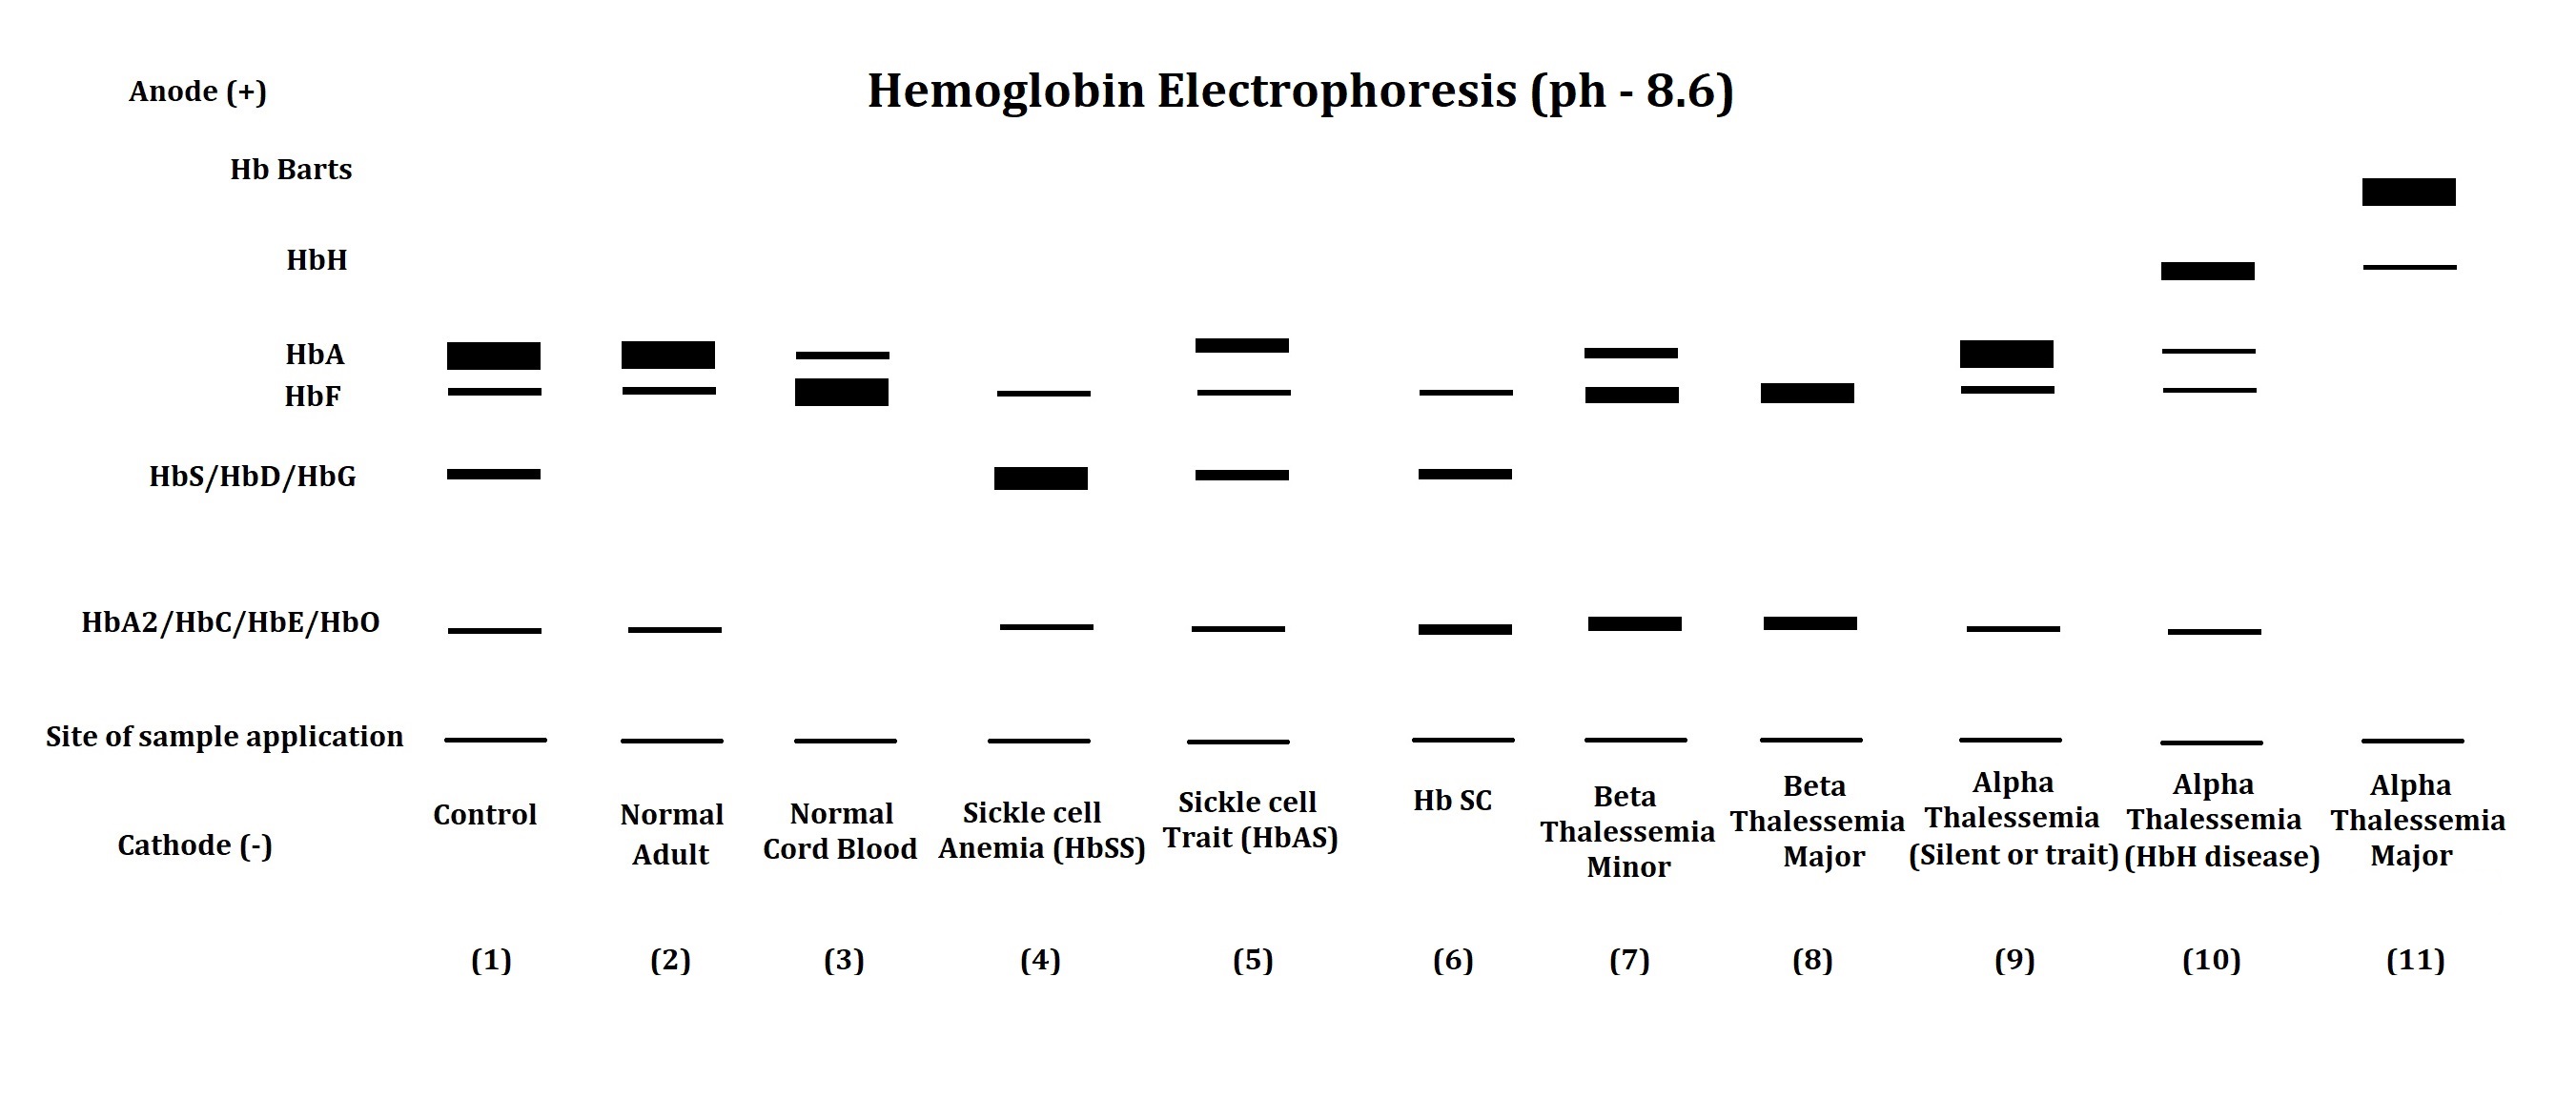
The electrophoresis apparatus shows abnormal hemoglobin electrophoretic patterns in various hemoglobinopathies and thalassemia (see Image. Schematic Diagram of an Electrophoresis Apparatus). Comparison of abnormal fractions with the control sample helps the clinician narrow the diagnosis of hemoglobinopathies and thalassemia. The following table shows the interpretation of hemoglobin electrophoretic patterns.[19][20]
| Lane No. |
Observation and Comment |
| 1 |
Electrophoretic pattern of artificial control sample - Its pattern compares the position of hemoglobin fractions in the patient’s sample. |
| 2 |
The electrophoretic pattern of a normal adult shows a major fraction of HbA and traces the presence of HbF and HbA2. |
| 3 |
The electrophoretic pattern of normal cord blood shows a major fraction of HbF and a trace presence of HbA. HbA2 may or may not be found in the normal cord blood samples. |
| 4 |
Electrophoretic pattern of a patient with sickle cell disease – Both the genes of the Beta globin chain have a mutation. Replacement of glutamic acid by valine at the 6th position of the beta-globin chain leads to a reduction in net charge on the molecule, leading to abnormal hemoglobin - HbS with less mobility than HbA. The major hemoglobin fraction in such cases is HbS with slightly elevated or normal HbF and HbA2. |
| 5 |
The electrophoretic pattern of a patient with sickle cell trait - 1 of 2 beta-globin chain genes has a mutation that forms HbS. In this case, the presence of HbS and HbA, HbF, and HbA2 are detected. |
| 6 |
Electrophoretic pattern of a patient with HbSC disease – A mutation in the beta-globin chain leads to the formation of HbS in 1 gene product and HbC in another. Replacement of glutamic acid by lysine at the 6th position of the beta-globin chain leads to the formation of HbC. In such cases, the presence of HbS and HbC is detected along with the presence of HbF and HbA2. HbA is remarkably absent in such patients with HbSC disease. |
| 7 |
Electrophoretic pattern of a patient with beta thalassemia minor – A mutation leads to reduced synthesis of the beta-globin chain in 1 of the beta-globin genes. Elevated HbF and HbA2 fractions, along with the presence of diminished or normal HbA fractions, signify the diagnosis of beta thalassemia minor. |
| 8 |
Electrophoretic pattern of a patient with beta-thalassemia major – A mutation leads to reduced beta globin chain synthesis in both the beta-globin gene. In such cases, marked elevated HbF and HbA2 are seen with the absence or minimal HbA. |
| 9 |
Patients with silent alpha thalassemia and alpha thalassemia minor may not be detected via electrophoresis as they have a regular electrophoretic pattern. Malfunctioning 1 or 2 out of 4 alpha-globin genes does not impede the synthesis of HbA, as other normal alpha-globin genes can take over the function. |
| 10 |
Electrophoretic pattern of a patient with HbH disease – 3 of 4 alpha-globin genes malfunction. In this case, the decline in HbA level is found along with the presence of HbH (tetramer of beta chain) or Hb Bart’s (tetramer of gamma chain) with relatively faster mobility than HbA. The decline in HbF and HbA2 is also detected in such cases of HbH disease. |
| 11 |
Electrophoretic pattern of a patient with alpha thalassemia major – All 4 alpha globin genes malfunction. Such cases of alpha thalassemia major show the absence of HbA, HbF, and HbA2, along with the presence of HbH and Hb Bart’s in hemoglobin electrophoresis. |
The presence of abnormal bands or attenuation of the normal band in serum protein electrophoresis can provide insight to the clinician regarding the ongoing disease process. The following table shows the main content of the zone of serum protein electrophoresis (pH – 8.6).[21]
| Zone |
Content |
| Albumin |
Albumin. |
| Albumin-alpha 1 Interzone |
HDL – High-Density Lipoprotein, Alpha-fetoprotein. |
| Alpha 1 zone |
Alpha 1 antitrypsin, AFP, Alpha 1–glycoprotein, thyroid binding globulin, and transcortin. |
| Alpha 1– Alpha 2-Interzone |
Alpha 1–antichymotrypsin, vitamin D binding protein. |
| Alpha 2 zone |
Ceruloplasmin, Alpha 2-macroglobulin, haptoglobin. |
| Alpha 2 - beta Interzone |
pre- Beta-lipoprotein. |
| Beta zone |
Transferrin, complement protein 3 (C3), Beta-lipoprotein - sometimes IgA & IgM. |
| Gamma zone |
Mainly IgG. Also, IgA, IgM, IgD & IgE. |
The following table shows conditions related to an abnormality in serum protein electrophoretic pattern.[21][22]
| Proteins |
Conditions causing increase |
Condition causing decrease |
| Albumin |
Hemoconcentration due to dehydration. |
Burns, nephrotic syndrome, protein-losing enteropathy, impairment of liver functions, chronic infections, malnutrition, and hemodilution in pregnancy |
| Alpha 1 globulins |
Pregnancy |
Alpha 1 antitrypsin deficiency. |
| Alpha 2 globulins |
Nephrotic syndrome, Corticosteroid therapy. |
Malnutrition, Liver failure, Wilson’s disease |
| Beta Globulins |
Iron deficiency anemia, obstructive jaundice, third trimester of pregnancy, Hypercholesterolemia type 2a |
Malnutrition |
| Gamma globulins |
Chronic infections, Amyloidosis, Lymphoma, Leukemia, Collagen vascular diseases
Sharp bands in the gamma-globin region can be seen in Monoclonal gammopathies such as multiple myeloma, solitary plasmacytoma, heavy chain disease, and plasma cell leukemia.
|
Agammaglobulinemia, hypogammaglobulinemia. |
The electrophoresis technique can also identify abnormally elevated or decreased enzyme isoforms. Various clinical conditions show specific enzyme patterns based on tissue/organ involvement which can help the clinician to diagnose and develop a treatment plan for the case. The following table shows the tissue origin of different isoforms of some plasma non-functional enzymes of clinical significance.
| Enzyme |
Isoforms |
Tissue of origin |
| Lactate dehydrogenase (LDH) [23] |
LDH 1 |
Cardiac muscle |
| |
LDH 2 |
RBCs, Brain |
| |
LDH 3 |
Brain, Leukocytes |
| |
LDH 4 |
Liver, Leukocytes |
| |
LDH 5 |
Skeletal Muscles |
| Alkaline Phosphatase (ALP) [24] |
Alpha 1 ALP |
Epithelial cells of biliary canaliculi |
| |
Alpha 2 ALP (Heat Labile) |
Liver |
| |
Alpha 2 ALP (Heat Stable) |
Placenta |
| |
Pre-Beta ALP |
Bone |
| Creatine kinase (CK) [25] |
CK-BB |
Brain |
| |
CK-MB |
Cardiac muscle |
| |
CK-MM |
Skeletal muscle |
The utility of electrophoresis is not limited to diagnostics. It is widely utilized for research in genomics and proteomics. Restriction fragment length polymorphism (RFLP), nucleotide sequencing, next-generation sequencing, southern blotting, western blotting, etc., are examples of a few techniques with electrophoresis as 1 of its steps. DNA fingerprinting is the technique forensic experts utilize to compare DNA acquired from the crime scene and the DNA of the suspects and/or victims. DNA fingerprinting is also utilized for confirmation of the biological parents of a child in case of a dispute.[26]
Quality Control and Lab Safety
Commercially available controls are utilized to compare the movement of the analyte of interest. They are widely used for hemoglobin, serum protein, and nucleic acid electrophoresis.
Caution is necessary when preparing electrophoresis gel, buffer preparation, setting up apparatus, running electrophoresis, staining, and visualization of the analyte. Monomers used in polyacrylamide gel preparation are carcinogenic. If contacted, the catalyst used in polyacrylamide gel preparation can cause free radical-related damage to the skin. None of the solutions should be mouth-pipetted. Barbital buffer containing sodium barbiturate is a known central nervous system depressant. Ethidium bromide, used in nucleic acid staining, is a known carcinogen. Direct exposure of the eye to ultraviolet rays during the visualization of the gel can cause severe damage to the eye.[27]
Enhancing Healthcare Team Outcomes
Diagnosing the medical condition via electrophoresis is optimally performed and used with an interprofessional team that includes internal medicine, biochemistry, laboratory medicine experts, laboratory technicians, and other healthcare team members. Clinical correlation of a patient’s history, examination, and other investigations with the electrophoresis pattern can help the clinician narrow down to the specific diagnosis. Specific diagnosis of the clinical condition helps the treating clinician to develop a treatment plan according to underlying pathology.