Continuing Education Activity
Audiometry is an essential means of assessing hearing thresholds in patients presenting with hearing loss. The audiogram quantifies and visually displays a patient's degree and type of hearing loss (sensorineural, conductive, or mixed). Furthermore, various etiologies of hearing loss may demonstrate characteristic patterns on the audiogram, making this testing modality critical for diagnostic purposes. Audiograms are most useful for objectively identifying deficits in hearing by looking at how sound travels through the auditory system via air conduction or bone conduction. Air conduction measures sound transmission from the outer ear, through the middle ear, and into the inner ear, where signals are sent to the central nervous system (CNS) for auditory processing. In contrast, bone conduction measures transmission only from the inner ear to the CNS. This activity reviews the interpretation of audiograms and their role in identifying patterns of otologic disease.
Objectives:
- Review the concept of pure tone thresholds and how they are measured during audiometry.
- Identify air conduction and bone conduction notation on the audiogram and understand the concept of masking.
- Summarize the differences between sensorineural hearing loss and conductive hearing loss as shown on an audiogram.
- Identify common patterns of abnormal hearing on an audiogram and associate these patterns with clinical diagnoses.
Introduction
More than 16% of adult Americans experience some degree of hearing loss.[1] Accurately diagnosing and managing hearing loss is essential in patients of all ages, whether for safety and quality of life in adults or for developmental reasons in children. Subtle findings in young patients may warrant referral for audiometry, as children with even slight hearing impairment may suffer from speech and language delays.
Audiometric threshold data, also known as pure-tone testing, have been used clinically since the 1920s to categorize the degree and type of hearing loss. Audiometric testing utilizes various intensities of sound emitted over a range of frequencies to determine deficits in hearing, and results are plotted on a graph known as an audiogram. The configurations and patterns displayed on the audiogram help healthcare providers to understand the etiology and severity of a patient's hearing loss.
Audiograms are most useful for objectively identifying deficits in hearing by looking at how sound travels through the auditory system via air conduction or bone conduction. Air conduction measures sound transmission from the outer ear, through the middle ear, and into the inner ear, where signals are sent to the central nervous system (CNS) for auditory processing. In contrast, bone conduction measures transmission only from the inner ear to the CNS.[2][3]
Despite the ability of this powerful tool to guide clinical practice in managing patients with hearing loss, many healthcare providers have difficulty accurately interpreting an audiogram.[4] This review aims to explore the basic principles of audiometry and discuss the audiogram's interpretation, including examples of common pathologies that can be diagnosed via audiometry.
Procedures
Pure-tone evaluations are performed in sound-treated rooms to eliminate ambient noise while obtaining hearing thresholds for both air-conducted and bone-conducted sounds. Air conduction tones are presented through inserted earphones or over-the-ear headphones. Bone conduction thresholds are obtained via an oscillating transducer placed on the mastoid process. Most commonly, tones at the frequency being tested are presented at decreasing intensity levels (in 5 or 10 dB steps) until becoming inaudible and then are again presented at increasing intensity until becoming audible again, a procedure known as the Hughson-Westlake method.[5]
Pure tone thresholds are then plotted on an audiogram, displaying the quietest sound at a given frequency that a patient is able to discern at least 50% of the time, measured in decibels Hearing Level (dB HL). Hearing Level is a scale based upon normative data for human hearing thresholds, devised such that 0 dB is the loudness at which most people can perceive a sound 50% of the time; individuals that can hear better than average may, therefore, have hearing thresholds that are lower than 0 dB. Some level of variability across the population is expected, and hearing thresholds up to 25 dB are considered normal. Variability is also expected when testing the same patient, due to differences in audiometry equipment, examiner, and patient factors; for this reason, a change in the hearing threshold of 5 dB is thought to be within the standard error of these measurements.
A typical audiogram measures thresholds at frequencies within a range slightly broader than that of human speech, including 250, 500, 1000, 2000, 3000, 4000, 6000, and 8000 Hz. The primary speech frequencies fall between 500 and 4000 Hz, although normal human hearing ranges from ~20 Hz to ~20,000 Hz.[6] The arithmetic mean of the air conduction thresholds at 500, 1000, and 2000 Hz is calculated for each patient and termed the "pure-tone average" (PTA), which provides a rapid and simple summary of a patient's hearing in the speech frequencies. The PTA, however, does not provide information about high frequency hearing loss.
If there is a substantial difference in hearing between ears, masking may be utilized. Masking is a frequently employed technique in which noise is introduced into the non-tested ear in order to prevent a tone being presented to the tested ear from being perceived in the non-tested ear, which might otherwise result in the patient indicating that they had heard the tone despite it being in the wrong ear. In practice, masking is applied for air conduction when there is a significant hearing threshold difference between ears (~40 dB for headphones and ~65 dB for insert earphones), as signals that are loud enough to overcome the interaural attenuation provided by the skull (the difference in loudness perceived between the ears when a sound is presented on one side of the head) will be transmitted to the contralateral side and may be heard by the non-tested ear if it hears substantially better than the tested ear.[7] Masking is also frequently applied when testing bone conduction because there is essentially no interaural attenuation with bone conduction, making it important to isolate the non-tested ear from the sound source.
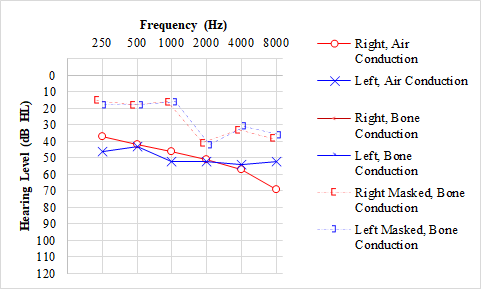
After collecting hearing data from the patient, pure tone thresholds at each frequency are displayed on an audiogram to facilitate interpretation. The X-axis represents the frequency of sound in hertz, and the Y-axis represents the (inverted) intensity of sound in decibels Hearing Level. The American Speech-Language-Hearing Association (ASHA) sets forth guidelines for the standardization of audiogram symbols.
ASHA Standard Audiogram Symbols
The following table shows the standard audiogram symbols.[8][9]
| Symbol |
Meaning |
| O |
Unmasked air conduction thresholds in the right ear |
| X |
Unmasked air conduction in the left ear |
| < |
Unmasked bone conduction in the right ear |
| > |
Unmasked bone conduction in the left ear |
| Δ |
Air conduction in the right ear |
| ? |
Air conduction in the left ear
|
| [ |
Bone conduction in the right ear |
| ] |
Bone conduction in the left ear |
When color is available, red indicates sounds detected by the right ear, and blue indicates sounds detected by the left ear; the <> and [] symbols that indicate left and right ear thresholds were chosen to vaguely resemble a patient's ears facing the interpreter of the audiogram.
Speech Audiometry
In addition to pure tone audiometry, speech audiometry is usually conducted as part of a comprehensive audiological evaluation. Two types of speech audiometry are usually performed: speech awareness or detection threshold (SAT or SDT) testing and speech reception threshold (SRT) testing. They provide different information, and therefore are both employed in most cases. The SAT is very similar to pure tone testing, except that the tones are replaced by words and the patient merely has to indicate when a word is heard. SRT involves the presentation of two-syllable words with equal emphasis on both syllables, and the patient is required to repeat the word correctly. This type of word is known as a "spondee," and examples include "racecar," "baseball," and "toothbrush." The SAT is usually within 10-15 dB of the SRT, and if it is not, a cause for the discrepancy should be sought. Likewise, the PTA and SRT should fall within 6-12 dB of each other. Beyond SAT and SRT, additional word recognition or speech discrimination testing may be performed, in which monosyllabic words are presented at 25-40 dB above the SRT, and the patient is asked to repeat the words. A normal score is 80% or greater; if the score decreases as the loudness of the words increases, the phenomenon is known as "rollover," which is indicative of retrocochlear pathology, such as a vestibular schwannoma.
Indications
Audiologic evaluation may be indicated when a patient perceives any degree of hearing loss. It may also be indicated when other otologic symptoms or history are noted, including tinnitus, dizziness, noise exposure, blast injury, or concern for ototoxic exposure. School-aged children and individuals working in loud occupational environments, such as soldiers and pilots, may routinely undergo hearing screenings.[6] If the screening results reveal hearing loss or a significant threshold shift (change in hearing level), they may be referred for a comprehensive evaluation by an audiologist to evaluate their hearing status further. Lastly, audiometry may be used to establish candidacy for hearing aids or even surgical intervention, such as the placement of cochlear implants.
Potential Diagnosis
The goal of audiogram interpretation is to determine the type and degree of a patient’s hearing loss.[10] The table below defines the categories of hearing loss based on severity:
| Hearing Range |
dB HL |
| Normal |
-10 to 25 |
| Mild |
26-40 |
| Moderate |
41-55 |
| Moderately Severe |
56-70 |
| Severe |
70-90 |
| Profound |
91+ |
Summary of Hearing Loss Categories
The three types of hearing loss are sensorineural (SNHL), conductive (CHL), and mixed (MHL) hearing loss.[11]
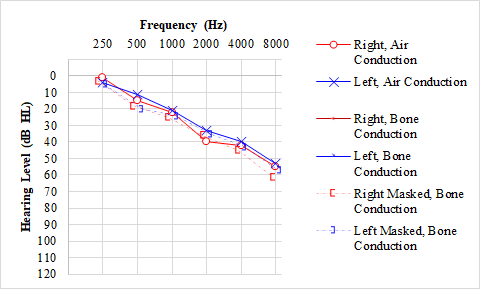
In sensorineural hearing loss, the hearing loss occurs due to damage to the inner ear and CNS higher auditory pathways and tends to be permanent but may be reversible in some situations. On an audiogram, pure SNHL is indicated by overlapping of the lines representing air conduction and bone conduction without the presence of any air-bone gaps >10 dB HL. SNHL may occur with processes such as inner ear (sensory) or vestibulocochlear nerve (neural) pathology, which is seen with presbycusis, noise exposure, infection, Ménière’s disease, aminoglycoside toxicity, and vestibular schwannoma, among many others.[11]
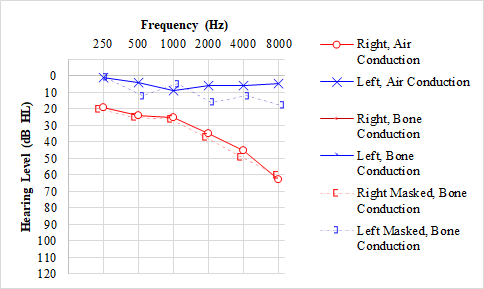
Conductive hearing loss occurs due to abnormal transmission of sound through the outer or middle ear without damage to the inner ear. An air-bone gap is noted on the audiogram, which is present when the difference between air conduction and bone conduction thresholds at a specific frequency is greater than 15 dB HL. With a pure CHL, the bone conduction thresholds should be normal, but the air conduction thresholds indicate hearing loss. CHL may occur due to cerumen impaction, otitis media, tympanic membrane perforation, ossicular disruption, and a foreign body in the ear, among other causes.[11]
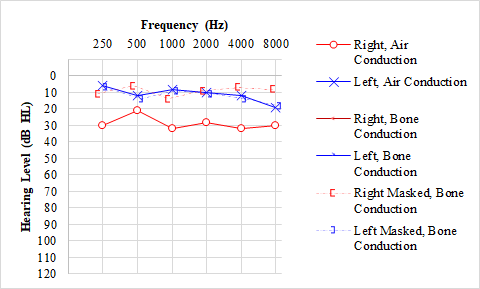
Finally, mixed hearing loss is a combination of SNHL and CHL, meaning there is abnormal sound conduction and damage to the inner ear and/or retrocochlear structures. This type of hearing loss presents on an audiogram as both a decrease in the bone line as well as an air-bone gap. Mixed hearing loss results from many different pathologies, including otosclerosis, a disease in which both the ossicles (CHL) and the inner ear (SNHL) are affected due to abnormal bone growth.[11]
Normal and Critical Findings
Normal Hearing
A normal audiogram displays air and bone conduction lines with thresholds of ≤25 dB HL at each of the tested frequencies in both ears.[12] When hearing loss is encountered, it should be classified by severity (see table above) and frequency, but some characteristic patterns often associated with specific diagnoses are below. According to National Institute for Occupational Safety and Health, a decrease in hearing acuity from one audiogram to the next is considered to represent a "significant threshold shift" when there is a decrease of 15 dB in one frequency, and that loss is confirmed by a repeat audiogram 30 days later. This significant threshold shift may indicate noise-induced hearing loss, particularly when it occurs at or around 4000 Hz. When there is a ≥20 dB asymmetry in two consecutive frequencies or a ≥15 dB asymmetry in any two frequencies between 2000 and 8000 Hz, particularly when accompanied by unilateral tinnitus, magnetic resonance imaging (MRI) of the cerebellopontine angle should be obtained to rule out the presence of a vestibular schwannoma.[13]
Presbycusis
Presbycusis represents the most common type of hearing loss that develops with advancing age. This type of hearing loss occurs due to age-related structural changes in the inner ear, producing a bilateral, symmetric, sensorineural hearing loss that is typically worse at higher frequencies. This pattern is represented by a gradual "downsloping" configuration in both ears on an audiogram.[14]
Ototoxicity
Ototoxicity may cause sensorineural hearing loss by damaging various structures of the inner ear, such as the cochlea's inner hair cells. Common causes include platinum-based chemotherapeutic agents, aminoglycosides, anti-malarial agents, antineoplastic drugs, loop diuretics, and high dosages of non-steroidal anti-inflammatory drugs. The audiogram pattern for ototoxicity is often similar to presbycusis, with a bilateral sensorineural hearing loss more prominent in the high frequencies.[15]
Ménière Disease
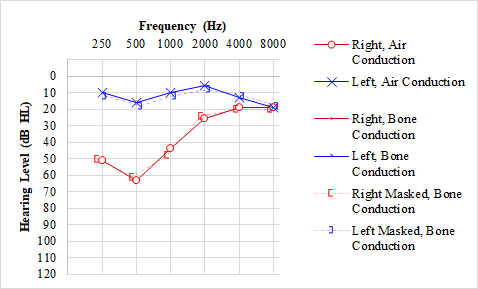
Ménière disease is characterized by episodes of a triad of vertigo, tinnitus, and fluctuating hearing loss in one ear.[16] A sensation of aural fullness may also be associated with these symptoms. Ménière's Disease most commonly presents as a unilateral sensorineural hearing loss that is most severe in the low frequencies. The audiogram shows an upsloping shape which may become flat in the late stages, depending on disease progression.[17][18] Over time, 5 to 50% of patients will develop Ménière's Disease in the second ear as well.[19]
Vestibular Schwannoma
Vestibular schwannoma, also known as acoustic neuroma, is a benign tumor of the internal auditory canal or the cerebellopontine angle that arises from the Schwann cells of the vestibular nerve. As the tumor grows, it compromises the function of the cochlear and/or vestibular nerves, which can, in turn, affect hearing and/or balance. The hearing loss associated with these tumors is a unilateral or asymmetric high-frequency sensorineural hearing loss on the affected side. These tumors are typically unilateral, except in neurofibromatosis type 2, in which bilateral tumors are diagnostic.[20]
Noise-Induced Hearing Loss
Noise-induced hearing loss is the permanent loss of hearing due to the destruction of stereocilia (hair cells) in the inner ear from repetitive exposure to loud sounds.[21] This type of hearing loss is often studied in populations with high occupational safety risks concerning hearing, such as construction workers, soldiers, and musicians. The pattern of hearing loss in this population may produce a distinct "U" or a "V" shaped "noise notch" on the audiogram, with the poorest hearing in higher frequencies ranges (approximately 3000 to 6000 Hz, often centered at approximately 4000 Hz); however, many different patterns exist. These changes may be unilateral or bilateral, depending on the type of noise exposure. Noise-induced hearing loss should be distinguished from the related, yet distinct, entity of acoustic trauma, which is hearing loss caused by a single loud impulse sound, such as an explosion. These patients will often present with SNHL or MHL and may have tinnitus and imbalance that progresses over many years. Recruitment, or discomfort with loud sounds within a particular frequency range, is also common after acoustic trauma.
Otitis Media with Effusion
Otitis media with effusion is an inflammation of the mucosa of the middle ear that causes fluid accumulation in a typically air-filled space. It may cause conductive hearing loss by affecting the transmission of sound from the air through the structures of the middle ear. This pathology may result in an air-bone gap of >15 dB HL.[22]
Otosclerosis
Otosclerosis occurs due to abnormal growth of the bone surrounding the cochlea, which can lead to fixation of the stapes to the oval window. Due to changes in the middle ear structure, otosclerosis commonly causes conductive hearing loss but may progress to mixed hearing loss in some cases. A classic feature, known as "Carhart's notch," may also be present, which is represented by a worsening in bone conduction hearing of 10 to 15 dB HL at 2000 Hz, sometimes accompanied by an apparent improvement of the air conduction threshold at that same frequency.[23]
Congenital Hearing Loss
Congenital, inherited hearing loss, as may result from Stickler syndrome, Waardenburg syndrome, connexin 26 gene mutations, and others, may present with a "cookie bite" pattern on pure tone audiometry. The "cookie bite" is a "U" shape to the air and bone lines that denotes mid-frequency SNHL centers around 1000 Hz but usually extends from 500 Hz to 2000 Hz before sloping back towards normal. While this pattern is often associated with genetic hearing loss, neither its specificity (18%) nor its positive predictive value (15%) for this diagnosis is high, and a U-shaped audiogram can also result from vestibular schwannoma, autoimmune inner ear disease, carbon monoxide poisoning, and other insults to the cochlea and eighth nerve.[24][25]
Interfering Factors
Several interfering factors may complicate the interpretation of audiograms. Firstly, it is essential to ensure a good fit of the earphones to prevent sound leakage, which may invalidate results by preventing reliable testing of the left and right ears independently.[26] Secondly, if masking is not employed when indicated or if the masking level is insufficient, inaccurate results may be obtained, again because of inadequate isolation of the ears.[27] Thirdly, audiogram validity depends on a patient's ability to indicate accurately and consistently when they hear sounds; accidental or deliberate false positives and negatives will compromise results. In functional or non-organic hearing loss cases, patients may report the inability to hear a pure tone even if their auditory system is structurally intact, making audiogram interpretation challenging.[28]
Patient Safety and Education
Overall, audiograms are a relatively safe and non-invasive testing modality. Patients should be informed that pure-tone evaluation does not represent a comprehensive audiological examination, and other tests may be needed to diagnose specific conditions that produce hearing loss.[29]
Beyond pure-tone audiometry, testing performed during a comprehensive audiological assessment includes tympanometry, otoscopy, speech audiometry, otoacoustic emissions, and validity checks, such as the Stenger test. These tests are useful for assessing middle ear function, the structural integrity of the outer and middle ear, the ability to interpret speech, cochlear hair cell function, and exaggeration of hearing deficits, respectively.[30][31]
Further audiometric testing that may be performed includes auditory brainstem responses and electrocochleography, but these tests are typically only performed for very specific indications, such as to follow up for a failed newborn hearing screen or to diagnose Ménière disease.
Clinical Significance
The audiogram represents a useful clinical test that can aid healthcare providers in determining the need for further diagnostic studies. By interpreting data from the audiogram together with the history and physical examination, therapeutic interventions may be offered according to patient presentation and goals. For instance, an audiogram showing an otherwise asymptomatic unilateral significant threshold shift may suggest the presence of a vestibular schwannoma, and an MRI may be warranted. Conversely, bilateral high-frequency SNHL in an older patient may suggest presbycusis, which would not require imaging, but may warrant fitting for hearing aids. In this way, the audiogram allows clinicians to quantify and characterize the degree and type of hearing loss, providing more targeted care for patients to improve their quality of life and occupational functioning.
Interprofessional team-based care coordination is necessary for these cases, involving family clinicians, ENT specialists, pediatricians, audiologists, and nursing staff, all utilizing open communication and accurate patient records so that every team member can contribute from their specialization leading to improved patient outcomes. [Level 5]